


1 Executive Summary
This is the environmental-sample comparability analysis of the Virridy Lume tryptophan-like fluorescence (TLF) sensor for freshwater E. coli, at Boulder Creek (Colorado Regulation 93 / 303(d)), a CDPHE-listed impaired waterbody with an E. coli geometric-mean threshold of 126 CFU/100 mL. All 856 paired observations use IDEXX Colilert as the freshwater reference. This paired environmental dataset is the evidence base for the alternative-indicator route (R-squared and Index of Agreement against an EPA reference method).
The analysis demonstrates strong agreement between the Lume and Colilert across multiple evaluation frameworks:
| Evaluation | Key Metric | Value | Sample Size |
|---|---|---|---|
| Threshold classification at 126 CFU/100 mL (recreational) | Bal. Acc / Kappa | 90% / 0.47 | n = 209 |
| Continuous regression (Boulder Creek) | R² / MAPE | 0.67 / 7.12% | n = 38 |
| Three-class categorical (supplementary) | Bal. Accuracy / Kappa | 95% / 0.84 | n = 334 |
| Binary at 1 CFU/100 mL (drinking-water) | Accuracy / Kappa | 91% / 0.82 | n = 361 |
| Binary at 10 CFU/100 mL (drinking-water) | Accuracy / Kappa | 92% / 0.84 | n = 361 |
| Chlorine residual detection (binary) | Accuracy / Kappa | 85% / 0.70 | n = 66 |
Over 75% of the Lume’s continuous predictions fall within the analytical uncertainty bounds of the Colilert reference method. At the recreational 126 CFU/100 mL threshold the Lume achieves 90% balanced accuracy (sensitivity 94%, specificity 86%, kappa 0.47) at a screening-oriented operating point; supplementary drinking-water thresholds show kappa 0.82–0.84 (“almost perfect” on the Landis & Koch scale). The Lume demonstrates higher reproducibility than culture-based methods (14% RPD vs. ≥26% for Colilert duplicates).
Primary regulatory resultIndex of Agreement — EPA Alternative Methods Calculator
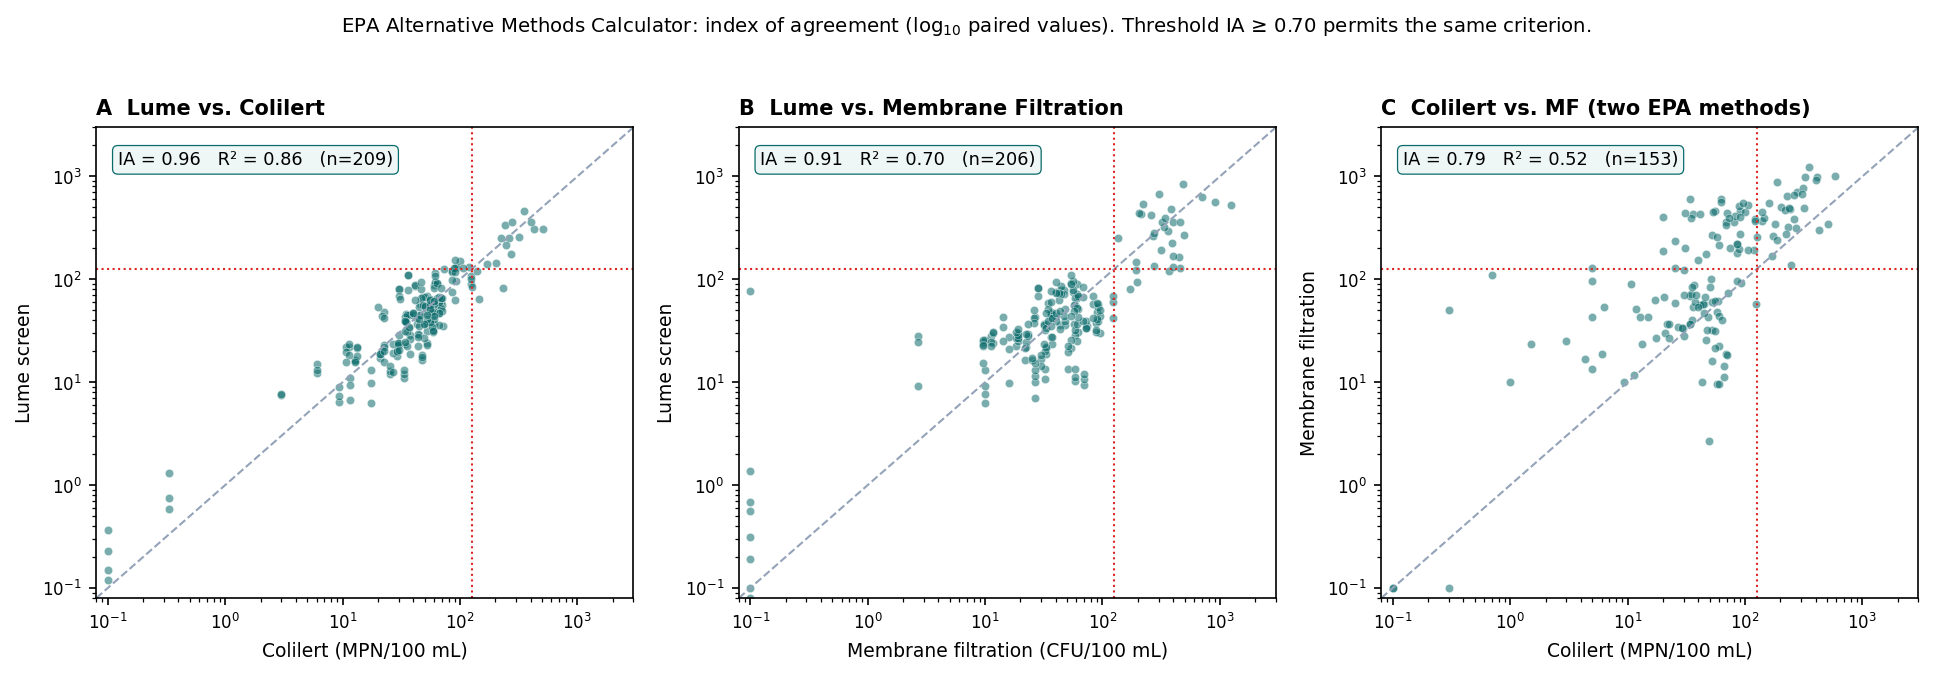
The decision metric for the EPA Recreational Water Quality Criteria Alternative Indicators and Methods framework is the Willmott index of agreement (IA) on log₁₀ paired values, computed by the EPA AltCalc tool. An IA ≥ 0.70 permits an alternative method to be used against the same numerical criterion (with R² > 0.60 as a secondary path). The Lume screen clears the threshold against both EPA reference methods — and agrees with each more closely than the two approved methods agree with each other.
| Comparison (reference vs. method) | n | IA | R² | Meets IA ≥ 0.70? |
|---|---|---|---|---|
| Colilert vs. Lume | 209 | 0.96 | 0.86 | Yes |
| Membrane filtration vs. Lume | 206 | 0.91 | 0.70 | Yes |
| Colilert vs. MF (the two EPA methods) | 153 | 0.79 | 0.52 | reference baseline |
Restricted to values within limits of quantification, IA is 0.92 (Colilert), 0.87 (MF), and 0.72 (Colilert–MF) — each still above 0.70 for the screen.
2 Method Description
2.1 Test Method (Virridy Lume)
| Parameter | Specification |
|---|---|
| Measurement principle | Tryptophan-like fluorescence (TLF) at 273 nm excitation / ~350 nm emission, with multivariate linear regression: log₁₀(CFU/100 mL) = β₀ + β₁·TLF + β₂·Turbidity + β₃·Temperature |
| Sensor unit | Lume V1.2 (results pooled across calibrated units) |
| Output | Continuous E. coli concentration estimate (CFU or MPN/100 mL) and categorical risk classification |
| Concurrent parameters | Turbidity (NTU), Temperature (°C) — used as regression model correction inputs |
| TLF detection limit | 0.05 ppb (tryptophan in DI water) |
| E. coli detection limit | ~10 CFU/100 mL (illustrative — correlated, in wastewater effluent; formal LOD to be finalized in validation) |
| Response time | 60 seconds per measurement |
| Regression model | Multivariate linear regression with fixed, per-device calibrated coefficients (each unit calibrated to its own coefficient set by a defined procedure; no per-site retraining). Features: TLF intensity, turbidity (NTU), temperature (°C). |
2.2 Reference Method (IDEXX Colilert)
| Parameter | Specification |
|---|---|
| Method | IDEXX Colilert / Quanti-Tray® |
| Regulatory status | Approved under 40 CFR Part 136 for E. coli enumeration |
| Output | Most Probable Number (MPN) or Colony Forming Units (CFU) per 100 mL |
| Incubation | 24 hours at 35°C (IDEXX Colilert; formulation to be confirmed with Boulder) |
| Known precision | ≥26% relative percent difference between duplicate samples (literature; Kenya groundwater study) |
2.3 Study Location
| Parameter | Value |
|---|---|
| Waterbody | Boulder Creek, Boulder, Colorado |
| Water type | Freshwater surface water (ambient and influenced by municipal WWTP effluent) |
| Concentration range observed | <1 to >400 CFU/100 mL |
| Regulatory context | Colorado Regulation 93 / 303(d) compliance monitoring — City of Boulder Utilities (6 monitoring locations on Boulder Creek, E. coli geometric mean threshold 126 CFU/100 mL). Coastal/beach recreational water monitoring via ASBPA is a longer-term goal. |
| Reference methods | IDEXX Colilert (E. coli, freshwater) & IDEXX Enterolert (enterococci, marine/coastal) — dual-indicator approach per EPA 2012 RWQC |
3 Data Overview
The existing dataset comprises several complementary analyses, all using IDEXX Colilert as the freshwater reference method (E. coli). The report is organized by deployment mode: preliminary Boulder Creek field data (§4); laboratory characterization on grab samples and controlled dilutions (§5–10), which carries the primary threshold-classification result; and two field deployment use cases — continuous fixed in-situ (§11) and mobile grab-and-read (§12). This consistency is important: every observation in this report is a direct Lume-vs-Colilert comparison against the same Part 136-approved method used for recreational water quality assessment on Boulder Creek. Future coastal/marine validation through the ASBPA partnership will add Enterolert (enterococci) paired data, completing the dual-indicator framework required by EPA’s 2012 RWQC.
| Analysis | n | Type | Source |
|---|---|---|---|
| Continuous regression (Boulder Creek field) | 38 | Paired field observations: Lume continuous estimate vs. Colilert grab sample | Boulder Creek (single-unit preliminary illustration; 31 inside Colilert uncertainty bounds, 7 outside). Regulatory metrics are reported pooled across deployed units. |
| Three-class categorical classification | 334 | Categorical bins: <10, 10–100, >100 MPN/100 mL | Laboratory validation with Colilert across controlled concentration ranges. |
| Binary classification (drinking water) | 361 | Binary at 1 and 10 CFU/100 mL thresholds | Chlorinated and unchlorinated drinking water supplies, all paired with Colilert. |
| Continuous (chlorinated vs. unchlorinated) | 57 | Paired scatter: 38 pre-chlorinated + 19 post-chlorinated | Drinking water, pre- and post-chlorination points. |
| Chlorine residual binary detection | 66 | Binary: chlorine present (>0 ppm) vs. absent | Supplementary analysis — not a primary indicator target but demonstrates multi-parameter capability. |
| Total paired observations | 856 | Across all analyses. Individual samples may appear in multiple evaluation frameworks. | |
Field Validation — Boulder Creek (direct in-situ deployment)
Lume readings from the in-situ Boulder Creek deployment paired to Colilert grab samples — preliminary, single-matrix field data. The controlled method comparison and the primary threshold-classification result are in the Laboratory Validation part below.
4 Continuous Regression Analysis
Direct comparison of Lume E. coli concentration estimates against Colilert laboratory results for 38 paired observations on Boulder Creek. The Colilert analytical uncertainty (±30%) is shown as horizontal error bars on each point.
4.1 Summary Statistics
| Statistic | Value | Interpretation |
|---|---|---|
| Coefficient of determination (R²) | 0.67 | 67% of variance in Colilert results explained by the Lume estimate. Strong for a field-deployed real-time sensor vs. a 24-hour culture method. |
| Mean absolute percentage error (MAPE, log-scale) | 7.12% | Average prediction error in log-transformed concentration space. Remarkably low given inherent Colilert variability. |
| Predictions within Colilert uncertainty (±30%) | 81.6% | 31 of 38 predictions fall within the reference method’s own analytical uncertainty bounds. |
| Sample size | n = 38 | Paired field observations, test dataset (not used for model training). |
| Concentration range (observed) | 20–400 CFU/100 mL | Spans over one order of magnitude. The full validation study will target <1 to >1,000 CFU/100 mL across the validation matrices (spiked where ambient levels do not reach the range). |
4.2 Paired Data
Complete paired dataset (observed Colilert vs. predicted Lume), sorted by observed concentration:
| # | Observed (Colilert, CFU/100 mL) | Predicted (Lume, CFU/100 mL) | Within ±30%? |
|---|---|---|---|
| 1 | 20 | 30 | No |
| 2 | 25 | 43 | No |
| 3 | 50 | 45 | Yes |
| 4 | 55 | 28 | No |
| 5 | 55 | 40 | Yes |
| 6 | 60 | 48 | Yes |
| 7 | 60 | 50 | Yes |
| 8 | 65 | 55 | Yes |
| 9 | 70 | 55 | Yes |
| 10 | 70 | 65 | Yes |
| 11 | 75 | 65 | Yes |
| 12 | 80 | 55 | No |
| 13 | 80 | 70 | Yes |
| 14 | 85 | 80 | Yes |
| 15 | 90 | 75 | Yes |
| 16 | 90 | 80 | Yes |
| 17 | 90 | 130 | No |
| 18 | 95 | 115 | Yes |
| 19 | 95 | 120 | Yes |
| 20 | 95 | 135 | No |
| 21 | 100 | 110 | Yes |
| 22 | 100 | 115 | Yes |
| 23 | 100 | 130 | Yes |
| 24 | 100 | 130 | Yes |
| 25 | 105 | 120 | Yes |
| 26 | 110 | 115 | Yes |
| 27 | 150 | 120 | No |
| 28 | 200 | 175 | Yes |
| 29 | 210 | 195 | Yes |
| 30 | 250 | 230 | Yes |
| 31 | 250 | 75 | No (but see note) |
| 32 | 280 | 340 | Yes |
| 33 | 300 | 350 | Yes |
| 34 | 300 | 370 | Yes |
| 35 | 320 | 290 | Yes |
| 36 | 350 | 350 | Yes |
| 37 | 380 | 360 | Yes |
| 38 | 400 | 305 | Yes |
Note: Sample #31 (obs=250, pred=75) represents a significant outlier. In further validation, such cases will be investigated for potential sampling errors, sensor fouling, or genuine environmental transients.
Independent field validation & multi-site dataset
The Boulder Creek analysis above is one site in a growing, geographically diverse field dataset. Across field deployments the method has been paired to 661 reference samples at 12 sites, including an independent recreational-water deployment on the Seine and Marne rivers (Paris) that corroborates the Boulder result on a different continent, matrix, and regulatory threshold.
Seine & Marne, Paris (independent deployment)
Four sensors returned 310 daily samples across three swimming sites over summer 2025. Classifying the 900 CFU/100 mL bathing threshold (the applicable European recreational limit) on a forward-in-time test split, the screen reached 96.8% overall accuracy and 94% balanced accuracy. This is an independent confirmation of the threshold-screening performance seen at Boulder Creek — a different matrix, criterion, and time period.
Multi-site scope
The 661-sample field set spans Boulder Creek (Colorado), the Seine/Marne (Paris), and additional US deployments including Chicago, Cleveland, Boston, and a brackish site. This breadth is what the EPA Alternative Methods and Standard Methods pathways require: a consistent, predictable relationship to reference methods across geographically diverse matrices and conditions.
Laboratory Characterization — Grab Samples & Dilutions
Paired Lume-vs-reference analyses on grab samples and controlled dilutions run in the lab (the colilert-lab bench dataset and the SDSU wastewater dilution series). This part carries the primary threshold-classification result at 126 CFU/100 mL (§5), with supplementary three-class, drinking-water, chlorination, and dilution analyses (§5–10). The two field deployment use cases — continuous and mobile — follow below.
5 Threshold Classification at 126 CFU/100 mL (Recreational)
The primary regulatory claim is categorical: correctly classifying a sample above or below the applicable recreational threshold. For Boulder Creek that threshold is the 126 CFU/100 mL geometric-mean standard. The result below is the Lume-vs-Colilert binary classification at 126, computed in-sample on the lab comparison dataset (n = 209 paired samples, pooled across sensors), reported at the screening operating point (sensitivity prioritized) used in Method LUME-1 and the manuscript.
5.1 Performance at the 126 CFU/100 mL Recreational Threshold
| Metric | Value | Interpretation |
|---|---|---|
| Balanced accuracy | 90.0% | Mean of sensitivity and specificity at 126 CFU/100 mL. |
| Sensitivity (true positive rate) | 94.1% | 16 / 17 observed exceedances correctly flagged. Screening operating point: sensitivity is prioritized so contamination events are rarely missed. |
| Specificity (true negative rate) | 85.9% | 165 / 192 non-exceedances correctly classified (27 false positives — the tolerable error for a screen). |
| Cohen’s kappa | 0.47 | “Moderate” agreement (Landis & Koch, 1977); lowered by the false positives that the sensitivity-first operating point accepts. |
| Overall accuracy | 86.6% | 181 of 209 correctly classified. |
| Sample size | n = 209 | Lab Lume–Colilert paired samples, in-sample. |
5.2 Confusion Matrix at 126 CFU/100 mL
| Observed <126 | Observed ≥126 | Row Total (Predicted) | |
|---|---|---|---|
| Predicted <126 | 165 | 1 | 166 |
| Predicted ≥126 | 27 | 16 | 43 |
| Column Total (Observed) | 192 | 17 | 209 |
5.3 Supplementary — Three-Class Categorical (<10 / 10–100 / >100 MPN)
The three-class breakdown below (n = 334) is retained as supplementary context. It characterizes agreement across concentration bands but is not the recreational compliance claim.
Three-Class Overall Performance
| Metric | Value | Interpretation |
|---|---|---|
| Overall accuracy | 92.2% | 308 of 334 correctly classified. |
| Balanced accuracy | 95.0% | Average per-class recall, unaffected by class imbalance. |
| Cohen’s kappa | 0.84 | “Almost perfect” agreement (Landis & Koch, 1977). |
| Total sample size | n = 334 | Laboratory validation samples, all paired with Colilert. |
Three-Class Per-Class Performance
| Class (MPN/100 mL) | Observed (n) | Sensitivity (Recall) | Precision (PPV) | Misclassification Direction |
|---|---|---|---|---|
| <10 | 202 | 99.5% | 94.8% | 11 predicted <10 were actually 10–100 (false negatives). 1 observed <10 predicted as 10–100. |
| 10–100 | 129 | 80.6% | 99.0% | 11 misclassified as <10, 14 as >100. The >100 misclassifications are conservative (over-reports risk). |
| >100 | 3 | 100% | 17.6% | All 3 observed >100 correctly detected. Low precision reflects conservative over-prediction from the 10–100 class. Zero false negatives at this critical threshold. |
Three-Class Raw Confusion Matrix
| Observed <10 | Observed 10–100 | Observed >100 | Row Total (Predicted) | |
|---|---|---|---|---|
| Predicted <10 | 201 | 11 | 0 | 212 |
| Predicted 10–100 | 1 | 104 | 0 | 105 |
| Predicted >100 | 0 | 14 | 3 | 17 |
| Column Total (Observed) | 202 | 129 | 3 | 334 |
Key finding: The model exhibits a conservative bias—it is more likely to overestimate contamination risk (predicting a higher category) than to underestimate it. This is desirable for public health protection. There are zero false negatives at the >100 threshold and only 1 false negative at the <10 threshold.
6 Supplementary — Binary Classification at Drinking-Water Thresholds
Supplementary. These two thresholds (1 and 10 CFU/100 mL) are relevant to drinking-water safety, not the recreational compliance claim (see §5 for the 126 CFU/100 mL recreational result). They are retained to characterize the sensor’s classification behavior at low thresholds. All samples paired with Colilert across chlorinated and unchlorinated supplies.
6.1 Performance at 1 CFU/100 mL Threshold
| Metric | Value | Derivation |
|---|---|---|
| Overall accuracy | 90.9% | (149 + 179) / 361 |
| Balanced accuracy | 91.0% | Mean of sensitivity and specificity |
| Cohen’s kappa | 0.82 | “Almost perfect” agreement |
| Sensitivity (true positive rate) | 93.9% | 179 / (179 + 10) — correctly detects ≥1 CFU |
| Specificity (true negative rate) | 86.6% | 149 / (149 + 23) — correctly classifies <1 CFU |
| Positive predictive value (PPV) | 88.6% | 179 / (179 + 23) |
| Negative predictive value (NPV) | 93.7% | 149 / (149 + 10) |
| False negative rate | 2.8% | 10 / 361 — missed contamination above threshold |
| False positive rate | 6.4% | 23 / 361 — false alarms (conservative direction) |
6.2 Performance at 10 CFU/100 mL Threshold
| Metric | Value | Derivation |
|---|---|---|
| Overall accuracy | 91.9% | (169 + 163) / 361 |
| Balanced accuracy | 92.0% | Mean of sensitivity and specificity |
| Cohen’s kappa | 0.84 | “Almost perfect” agreement |
| Sensitivity (true positive rate) | 95.3% | 163 / (163 + 8) — correctly detects ≥10 CFU |
| Specificity (true negative rate) | 89.0% | 169 / (169 + 21) — correctly classifies <10 CFU |
| Positive predictive value (PPV) | 88.6% | 163 / (163 + 21) |
| Negative predictive value (NPV) | 95.5% | 169 / (169 + 8) |
| False negative rate | 2.2% | 8 / 361 — missed contamination above threshold |
| False positive rate | 5.8% | 21 / 361 — false alarms (conservative direction) |
6.3 Raw Confusion Matrices
| Threshold = 1 CFU/100 mL | |||
|---|---|---|---|
| Observed <1 | Observed ≥1 | Total | |
| Predicted <1 | 149 | 10 | 159 |
| Predicted ≥1 | 23 | 179 | 202 |
| Total | 172 | 189 | 361 |
| Threshold = 10 CFU/100 mL | |||
|---|---|---|---|
| Observed <10 | Observed ≥10 | Total | |
| Predicted <10 | 169 | 8 | 177 |
| Predicted ≥10 | 21 | 163 | 184 |
| Total | 190 | 171 | 361 |
7 Chlorination Effects on Sensor Performance
Analysis of Lume performance across pre-chlorinated (untreated) and post-chlorinated (treated) drinking water samples. This is relevant because it demonstrates sensor behavior across a treatment boundary that fundamentally changes the relationship between TLF and viable E. coli.
7.1 Pre-Chlorinated Performance
| Metric | Value |
|---|---|
| Sample size | n = 38 |
| Observed concentration range | 3–200 CFU/100 mL |
| Predicted concentration range | 0.15–800 CFU/100 mL |
| Qualitative agreement | Strong positive correlation. Points cluster around 1:1 line. One significant outlier (obs=200, pred=800). |
7.2 Post-Chlorinated Performance
| Metric | Value |
|---|---|
| Sample size | n = 19 |
| Observed concentration | ~0.1 CFU/100 mL (all below detection) |
| Predicted concentration range | 0.05–6.0 CFU/100 mL |
| Interpretation | Chlorination inactivates E. coli but does not immediately eliminate TLF signal from cellular material. The Lume slightly over-predicts in post-chlorinated water, which is the conservative (protective) direction. Most predictions remain below 1 CFU/100 mL. |
Implication: For recreational water monitoring applications (the primary target), chlorinated effluent near swim beaches and river access points is a relevant matrix. The data shows the Lume performs well for pre-treatment assessment. Post-chlorination overestimation is expected and conservative. The method documentation should specify expected behavior in chlorinated matrices.
8 Chlorine Residual Detection
Supplementary analysis: the Lume can also detect the presence of chlorine residual as a binary classification. While not a primary target, this demonstrates the sensor’s multi-parameter intelligence and its potential for treatment process monitoring.
8.1 Performance Summary
| Metric | Value | Derivation |
|---|---|---|
| Overall accuracy | 84.8% | (29 + 27) / 66 |
| Balanced accuracy | 85.0% | Mean of sensitivity and specificity |
| Cohen’s kappa | 0.70 | “Substantial” agreement (Landis & Koch) |
| Sensitivity (detects chlorine present) | 84.4% | 27 / (27 + 5) |
| Specificity (detects chlorine absent) | 85.3% | 29 / (29 + 5) |
| Sample size | n = 66 | 29 chlorine-absent + 32 chlorine-present + 5 FP + 5 FN = 66 |
9 Method Precision
Comparison of measurement precision between the Lume (TLF) and culture-based methods (Colilert). Precision is a critical element of the evaluation: an indicator method should demonstrate comparable or superior precision to the reference method.
| Precision Metric | Lume (TLF) | Culture-Based | Source |
|---|---|---|---|
| Duplicate relative percent difference (RPD) | 14% | ≥26% | Kenya groundwater study (Sorensen et al., 2018). Average RPD of duplicate measurements. |
The Lume demonstrates nearly 2× better precision than culture-based duplicate measurements. This has important implications for the comparability analysis:
- Some apparent disagreement between the Lume and Colilert reflects Colilert’s own imprecision, not sensor error.
- The Colilert ±30% analytical uncertainty bounds used in Figure 4.1 are derived from this known reference method variability.
- The statistical analysis should include a formal estimate of reference method variability to contextualize apparent discrepancies.
- The planned validation study includes duplicate Colilert grabs every 10th sample to generate a site-specific reference method precision estimate for Boulder Creek.
Three-Way Method Comparison: Lume vs. Colilert vs. Membrane Filtration
The two EPA-approved reference methods (Colilert and membrane filtration) disagree with each other more than the Lume disagrees with Colilert. On the dedicated Colilert–MF replicate study (n = 153) the two methods correlate at only R² = 0.52, with a log-space slope of 0.63 and a +0.34 log₁₀ bias — MF returns ~2.2× higher counts than Colilert, most pronounced at low concentrations. This is consistent with the peer-reviewed values (Knopp et al., 2026, Water Research 302, 126099, Fig. 5: r = 0.764, R² = 0.584; 161 pairs, 8 zero-valued excluded → 153).
By ISO 17994:2014 (the international standard for comparing two microbiological methods), MF and Colilert differ by a mean relative difference of +79% (95% CI +60 to +97%) against a ±20% bathing-water limit — the two accepted methods are not equivalent to each other. This inter-method disagreement sets the ceiling any sensor can reach against a single culture reference.
| Comparison | n | R² | Bias (log₁₀) | Bal. acc, ≥126 | Bal. acc, median split |
|---|---|---|---|---|---|
| 1 — MF vs. Colilert (both EPA-approved) | 153 | 0.52 | +0.34 | 0.86 | 0.80 |
| 2 — Lume vs. Colilert (Colilert-trained) | 209 | 0.861 | 0.00 | 0.90 | 0.81 |
| 3 — Lume vs. MF (MF-trained) | 206 | 0.702 | 0.00 | 0.98* | 0.75 |
The Lume fits its training reference well (R² = 0.86 against Colilert, 0.70 against MF); the lower fit against MF tracks MF’s own noisier agreement (comparison 1), not a sensor limitation. Replicate precision favors the sensor (RPD 14% vs 43.5% Colilert / 57.9% MF). Sensor-to-reference agreement is bounded by reference-method reproducibility, not by the Lume.
*Single-event caveat. Every ≥126 CFU/100 mL exceedance in this dataset comes from a single Boulder Creek high-flow episode (the bench dilution series topped out at 123 CFU/100 mL), so the ≥126 balanced-accuracy figures rest on one event. The median-split columns, which split each session at the reference median (balanced classes not tied to one event), are the more robust read (~0.75–0.81) and the indicative performance across the ordinary concentration range. All metrics are in-sample.
Regression (predicted vs. observed, log-log; each recomputes its R² in your browser)
Each chart recomputes its own log-log fit in your browser. Gray error bars = 95% CI. Points are green under one consistent rule across all three panels: every value carries a Poisson-type 95% CI (Colilert = published QuantiTray MPN CI; MF = exact Poisson CI on the count, keyed to the reported value as a count from 100 mL), and green means the two CIs overlap. In comparison 1 both sides are real method measurements. In comparisons 2 and 3 the Lume prediction is given the same CI as the reference it is compared against, i.e. we assume Lume’s measurement CI is no worse than the reference method’s. This is deliberately conservative: Lume’s own regression prediction interval is ~7× wide (±0.43 log10) vs the reference CI’s ~1.5×, so it denies Lume the benefit of its true, larger uncertainty rather than letting it inflate agreement. Overlap: 33% / 84% / 63% (comparisons 1–3). Axes are log-log, square 1:1.
1 · MF vs. Colilert (n=153)
2 · Lume vs. Colilert (n=209)
3 · Lume vs. MF (n=206)
log10(Colilert) = β0 + β1·mon2 + β2·temp + β3·tof + the mon2 × temp × tof interactions (8 terms). Green marks points where Lume’s assigned CI overlaps Colilert’s QuantiTray CI (84%).
log10(MF) = β0 + β1·mon2 + β2·temp + β3·tof + interactions. Every ≥126 exceedance is a field-stream sample (bench tops out at 123 CFU/100 mL). Green marks points where Lume’s assigned CI overlaps MF’s Poisson CI (63%).
Agreement (Bland–Altman, log10 difference)
Per-comparison agreement on the log10 scale: each point is log10(compared) − log10(reference) against the pair mean. Solid line = mean bias, shaded band = 95% limits of agreement (bias ± 1.96·SD). A band centered on 0 with tight width = good agreement.
1 · MF vs. Colilert
2 · Lume vs. Colilert
3 · Lume vs. MF
Exceedance classifier (logistic, ≥126 CFU/100 mL)
For each comparison a binary logistic regression is fit, P(reference ≥ 126) ~ log10(compared value), and the confusion matrix is read at the Youden-optimal probability cut. Metrics are in-sample. Single-event caveat: every ≥126 exceedance is a Boulder Creek field-stream sample from one high-flow episode (32, 17, and 32 positives for comparisons 1–3), so sensitivity is optimistic for an unseen new event; the bench dilution series contributes only negatives.
1 · MF vs. Colilert
2 · Lume vs. Colilert
3 · Lume vs. MF
Classifier at the median split (above vs. below the reference median)
The same logistic classifier, but the cut is each reference’s own median value (shown in each panel) instead of the 126 threshold. This splits every session’s samples into balanced halves, so it is not dominated by the single high-flow event and gives a more robust read of discrimination across the ordinary concentration range. Metrics are in-sample.
1 · MF vs. Colilert
2 · Lume vs. Colilert
3 · Lume vs. MF
Interactive version — per-point confidence-interval overlap, Bland–Altman agreement, and the full classifier breakdown (including the median split): validation.thelume.ai/colilert-lab.
Formal MDL study: A formal method detection limit (MDL) study has not yet been performed under the standardized EPA protocol. This is a required deliverable and is planned as part of the validation study.
10 Controlled Wastewater Dilution Series (SDSU)
On 20 May 2026, Lume sensor 50056 was evaluated in a controlled eight-step raw-wastewater dilution series (0, 1, 5, 10, 25, 50, 75, 100 % wastewater in tap water) at the Water Quality Laboratory, Department of Civil Engineering, San Diego State University. Three references were run in parallel: an Aqualog benchtop EEM fluorometer (inner-filter–corrected, treated as ground truth), a Turner C3 in-situ fluorometer (a widely used commercial CDOM/TLF instrument), grab-sample lab turbidity, and IDEXX Colilert at four concentrations. Because every step is the same wastewater diluted in clean water, the true organic and microbial concentration is known to fall linearly with dilution — making this a controlled test of each method’s response and of the sensor’s correction chain.
10.1 The method’s correction chain recovers linearity
Applying the draft method’s corrections — temperature normalization (Bedell 2022 / Watras) followed by turbidity recovery from the backscatter channel (Skinner 2024) — substantially improves the single-predictor calibration for both the Lume and the reference fluorometer. Turbidity recovery does the heavy lifting; the ~2 °C range in this experiment made the temperature step negligible here.
| Sensor / channel | Raw R² | Corrected R² | Inferred WW% RMSE (raw → corrected) |
|---|---|---|---|
| Lume TLF (LED 512 / bias 3000) | 0.681 | 0.804 | 24.3 → 17.5 pp (MAE 20.9 → 14.7) |
| Turner C3 TLF (280 nm) | 0.397 | 0.613 | 43.6 → 28.2 pp (MAE 38.8 → 25.3) |
This is direct, controlled evidence that the temperature-then-turbidity correction chain specified in Method LUME-1 (defined in §10, applied in §12) does what the method claims: it reveals the underlying linear dose-response that raw fluorescence obscures.
10.2 The Lume outperforms a commercial in-situ fluorometer
- Low-end sensitivity. At the 0 → 1 % step, the Lume resolves the change at SNR 4.73 vs the Turner C3’s 2.70 — about 75 % more reliably per reading.
- Linear regime (0–25 %). The two TLF channels are statistically equivalent (raw R² 0.921 vs 0.908).
- Inner-filter regime (50–100 %). The Turner TLF reverses direction (raw R² 0.289) while the Lume compresses gracefully (R² 0.798) — roughly 3× more predictive where conventional in-situ fluorometers fail. After identical corrections the Lume retains its lead (0.804 vs 0.613).
10.3 An independent full-range channel unavailable on the reference
The Lume’s optical time-of-flight backscatter channel tracks the Aqualog ground truth at R² = 0.999 across all eight windows — including the high-strength 50–100 % regime where every fluorescence channel (including the Turner CDOM channel) degrades. In high-strength water, particle loading is a more robust proxy for organic concentration than fluorescence, and the Lume derives it from the same instrument, on the same timestamp, with no additional sensor.
10.4 A direct measurement of reference-method uncertainty
Because the true concentration is linear by construction, any departure is measurement error, not biology. Yet single-dilution Colilert extrapolations to 100 % ranged from 12,000 to 13,000,000 MPN/100 mL (~1,000×) depending on which dilution anchored the estimate, and the 10 % sample fell three orders of magnitude below what the 100 % sample predicts. This quantifies the grab-sample variability that motivates continuous indicator sensing, and supports treating the culture reference as a value carrying its own measurement uncertainty rather than an error-free point (Method LUME-1 §12.5).
Full interactive analysis — per-combo correction ladders, reference-sensor comparison, and hold-one-window-out re-fitting: validation.thelume.ai/wastewatertest.
Field Deployment Use Cases — Continuous & Mobile
The controlled bench and dilution work above characterizes the method on grab samples run in the lab. The two sections below report how the same sensor and correction chain perform in the field, in two operationally distinct modes: a continuous, fixed in-situ deployment (recreational surface water) and a mobile, grab-and-read deployment (drinking water). These are the live, deployed models — not lab dilutions.
11 Use Case A — Continuous, In-Situ Deployment (Recreational)
In the primary deployment mode the Lume is fixed in the water column and estimates E. coli continuously, flagging threshold exceedances in near-real time to drive dashboard alerts. It is evaluated here against IDEXX Colilert / Quanti-Tray grab samples collected in situ across operating deployments — Boulder Creek, Chicago, and Boston. This is the same model that runs live on the customer dashboards, re-evaluated against the latest grabs on every page load (full interactive version linked below). Section 4 shows a single-unit illustrative subset; this section reports the full multi-site deployed model.
11.1 Deployed continuous model
A single joint mixed-effects regression (random per-sensor intercept and per-sensor TLF/turbidity slopes, empirical-Bayes shrinkage) on 20 °C-normalized, baseline-relative TLF and fouling-corrected turbidity, retaining the biological TLF×temperature term. Fit over nine field sensors: R² = 0.65, RMSE = 0.38 log₁₀(MPN), MAPE(log) = 16.4%, on n = 68 paired grabs (60 Boulder, 8 Chicago; Denver contributes 0), spanning eight sites. Metrics are in-sample by design (out-of-sample validation deferred); the model is the one deployed to the customer dashboards and re-scored live against incoming grabs.
11.2 Exceedance classifier (deployed alert)
The safe/unsafe alert thresholds the continuous prediction at an 88-CFU operating point (a buffer below the 126 action limit, tuned to balance sensitivity and specificity). In-sample performance: sensitivity 0.79, specificity 0.80, balanced accuracy 0.80, quadratic weighted kappa 0.64 (three-level accuracy 0.81). This is the deployed detector driving dashboard alerts; it replaced a class-balanced multinomial that over-flagged low readings (specificity ~0.58).
11.3 The residual is grab variability, not sensor error
The field prediction error (0.38 log₁₀) decomposes into independently grounded measurement terms — every term is a measurement or a published value, not an assumption.
| Error component | σ (log₁₀) | Basis |
|---|---|---|
| Sensor (Lume) | 0.16 | Lab reproducibility, 3 co-located units (ISO 15839 / 5725) |
| Grab (collection / handling) | 0.10 | Field-duplicate reproducibility (McCarthy 2008; Harmel 2016) |
| Colilert (assay) | 0.10 | Quanti-Tray/2000 95% counting CI |
| Measurement floor (quadrature) | 0.21 | √(0.16²+0.10²+0.10²) |
| Field prediction error (total) | 0.38 | Predicted vs grab, in-sample |
| Unresolved (representativeness + model) | ~0.32 | √(0.38²−0.21²); grab representativeness, not yet quantified |
The dominant unexplained term is grab representativeness: same-day grabs at a near-identical sensor reading return E. coli differing by 3–9× (up to ~1 log in 30–80 min). The sensor integrates the water continuously, so a single instantaneous grab is a noisy target it cannot be expected to match point-for-point — the same reference-uncertainty argument the method makes at §9.
Live, self-updating version — per-site scatter, the full error budget, and the deployed classifier evaluated against the latest grabs: validation.thelume.ai/colilert.
12 Use Case B — Mobile, In-Situ Grab-and-Read (Drinking Water)
In the mobile mode the same sensor is carried between water points and read on freshly collected samples (grab-and-read), with a GPS track documenting the route. It is validated against the Aquagenx CBT most-probable-number method in two drinking-water programs — Amazi Meza (Rwanda) and DRIP (Kenya). This use case sits in a drinking-water / WHO risk framework rather than the EPA recreational target of this document; it is included to show the TLF method and its correction chain generalize across deployment modes and reference methods.
12.1 Calibration model and equivalence
Because the CBT reference is right-censored at its upper detection limit of 100 CFU/100 mL, the model is a right-censored (Tobit) regression on log₁₀(E. coli + 1) with eight transparent parameters (baseline-subtracted fluorescence, temperature, turbidity proxy, plus a per-sensor 2-point calibration). Fit: R² = 0.52, σ̂ = 0.61 log₁₀, on n = 216 paired Lume–CBT observations across 3 sensors and 2 countries. Leave-one-observation-out, the Lume agrees with CBT 88% of the time within the combined ±0.92 log₁₀ measurement uncertainty. Under a two one-sided test (TOST) against a ±0.65 log₁₀ margin — the published 95% CI of a single CBT bag — the Lume is statistically equivalent to CBT on average (p < 0.001).
12.2 Risk classification
| Classifier | Bal. acc | Sensitivity / specificity | Notes |
|---|---|---|---|
| ≥10 CFU (WHO intermediate risk) — deployed Tobit | 85% | 76% / 93% (AUC 0.892) | ~90% of the ~92.5% CBT-vs-Colilert reference ceiling |
| ≥10 CFU — class-balanced logistic | 83% | 84% / 82% (AUC 0.885) | Alternative operating point |
| 3-level risk tier (<10 / 10–99 / ≥100) | — | 97% within ±1 tier | Off by >1 tier in ~1 of 50 samples |
| ≥1 CFU (any detection) | 73% | 62% sensitivity | Misses ~40% of 1–9 CFU; cannot certify zero-E. coli |
12.3 The CBT reference itself is imprecise
The 88% agreement should be read against how noisy the reference is: a single CBT test carries a 95% CI of roughly 1.2–1.4 log₁₀, and its per-bag CI half-width is ±0.65 log₁₀ (Gronewold 2017). Independent benchmarks: CBT vs membrane filtration r = 0.904 (Stauber 2014); field-vs-lab CBT operator repeatability ρ = 0.88 (Heitzinger 2017); CBT vs Colilert presence/absence ~92–93% (KWR/JMP 2022). The Lume agrees with CBT to within CBT’s own measurement noise.
12.4 Chlorination efficacy
Free chlorine attenuates tryptophan-like fluorescence, so effective chlorination lowers the Lume signal. In the samples where free chlorine was measured (n = 66, all Kenya), 100% of the 30 chlorinated samples (Cl₂ > 0, all 0 CFU by CBT) were correctly classified as safe — the sensor cleanly separates chlorinated from unchlorinated water.
This use case anchors a Gold Standard dMRV Pilot 14 (approved Sept 2025), authorizing Lume E. coli estimates to substitute for laboratory grab sampling under Safe Drinking Water for Schools Parameter 18. Full interactive analysis, GPS track, and per-sensor tables: validation.thelume.ai/cbt.
13 Conclusions & Regulatory Readiness
13.1 What the Existing Data Demonstrates
| Finding | Evidence | |
|---|---|---|
| ✓ | Strong quantitative agreement with Colilert on Boulder Creek | R² = 0.67, MAPE = 7.12%, 81.6% of predictions within Colilert uncertainty. (Section 4) |
| ✓ | Excellent categorical classification at management-relevant thresholds | 92% accuracy, 95% balanced accuracy, kappa = 0.84 across three bins. (Section 5) |
| ✓ | Reliable binary detection at low regulatory thresholds | 91–92% accuracy at 1 and 10 CFU/100 mL. Kappa 0.82–0.84. (Section 6) |
| ✓ | Conservative error direction (protects public health) | False positive rate exceeds false negative rate across all analyses. Model over-predicts risk rather than under-predicts. (Sections 5, 6, 7) |
| ✓ | Superior precision vs. reference method | 14% RPD vs. ≥26% for culture-based duplicates. (Section 9) |
| ✓ | Characterized behavior across chlorinated/unchlorinated matrices | Strong pre-chlorination performance. Conservative post-chlorination behavior documented. (Section 7) |
13.2 Gaps to Address in the Validation Study
| Gap | How the Planned Study Addresses It | |
|---|---|---|
| ● | Limited sample size for continuous regression (n=38) | Boulder matrix: 6 sites × 52+ weeks = 400–600 paired observations over 12 months (one matrix of the Table 6-1 set). 10–15× more data. |
| ● | Narrow concentration range (20–400 CFU/100 mL) | 6 diverse recreational monitoring sites span upstream reference (<1 CFU) through WWTP-influenced (>1,000 CFU during events). Coastal/beach sites via ASBPA partnership will expand range further. |
| ● | No formal MDL study (40 CFR Part 136 Appendix B) | Planned as Workstream 4, Task 4.1. Laboratory and field MDL determination. |
| ● | No §8.5.1 threshold-classification comparability analysis yet | Planned as Workstream 4, Task 4.3. Will include equivalence testing (TOST), Bland-Altman, regression analysis. |
| ● | Seasonal coverage incomplete | 12 month deployment captures all seasons including spring runoff and winter low-flow. |
| ● | Independent-laboratory operation | Boulder staff will be trained to operate sensors. The reference-method analyses must be run by an independent, unaffiliated laboratory (EPA §6.1.1); nationwide approval comes from matrix breadth analyzed by that single independent lab, not from multiple laboratories. The operator-vs-laboratory interpretation is put to EPA (Question C2). |
13.3 Assessment
The Boulder Creek / Colilert dataset provides a strong environmental-sample basis that the Lume produces results consistent with the approved Colilert reference method for freshwater microbial screening. It supports engagement with CDPHE and EPA on the alternative-indicator route, with Boulder Creek as the lead validation matrix (Reg 93 / 303(d)). Additional matrices and multi-condition sampling broaden the evidence base.