Lume performance against laboratory reference methods
The Lume is a submersible optical sensor that estimates E. coli from tryptophan-like fluorescence (TLF), with turbidity from an optical time-of-flight (ToF) channel and water temperature from the same unit. A hand-held configuration reads a bucket of freshly collected water in about a minute. An in-situ configuration stays in the water, reports over a cellular link and feeds an hourly estimate for each site. This page compares both with the laboratory culture methods that regulators and water programs use, in recreational and drinking water, and reports turbidity and a wastewater dilution series.
loading…
Summary of results
| Configuration and scoring | Reference | n | Result |
|---|---|---|---|
| Recreational water | |||
| Hand-held, laboratory grabsPairs within both assays' quantification limits [3] | Colilert | 190 | Index of agreement 0.91 |
| Hand-held, laboratory grabsSame pairs [3] | Membrane filtration | 184 | Index of agreement 0.88 |
| The two reference methodsSame pairs [3] | Colilert against membrane filtration | 134 | Index of agreement 0.71 |
| Hand-held, laboratory grabsExceedance of 126 CFU/100 mL, in-sample [3] | Colilert | 209 | Balanced accuracy 90%16 of 17 exceedances flagged |
| In-situ, hourly nowcastEach grab scored against the estimate published before its result was known | Colilert | — | — |
| In-situ, dashboard estimateIn-sample: the served model was fitted on many of these grabs | Colilert | — | — |
| Drinking water | |||
| Hand-held, fieldSensor and sampling day held out [2] | Compartment bag test | 75 | Balanced accuracy 93% at 10 MPN/100 mL73% at 1 MPN/100 mL; index of agreement 0.82 |
| Turbidity and wastewater | |||
| Bench, two units, 0 to 20 NTUServed conversion | Formazin standards, lab turbidimeter | 9 steps | RMS error 1.0 to 1.1 NTU |
| Bench, raw wastewater diluted 0 to 100% | Lab turbidimeter, benchtop fluorometer | 8 steps | Turbidity R² 0.99Fluorescence linear to 25% wastewater |
The index of agreement (Willmott's d on log10 concentrations) is the statistic the US EPA uses to accept a site-specific alternative indicator, with 0.70 as the bar. Balanced accuracy is the mean of sensitivity and specificity at a threshold. Bracketed numbers refer to the papers under Sources.
The instrument
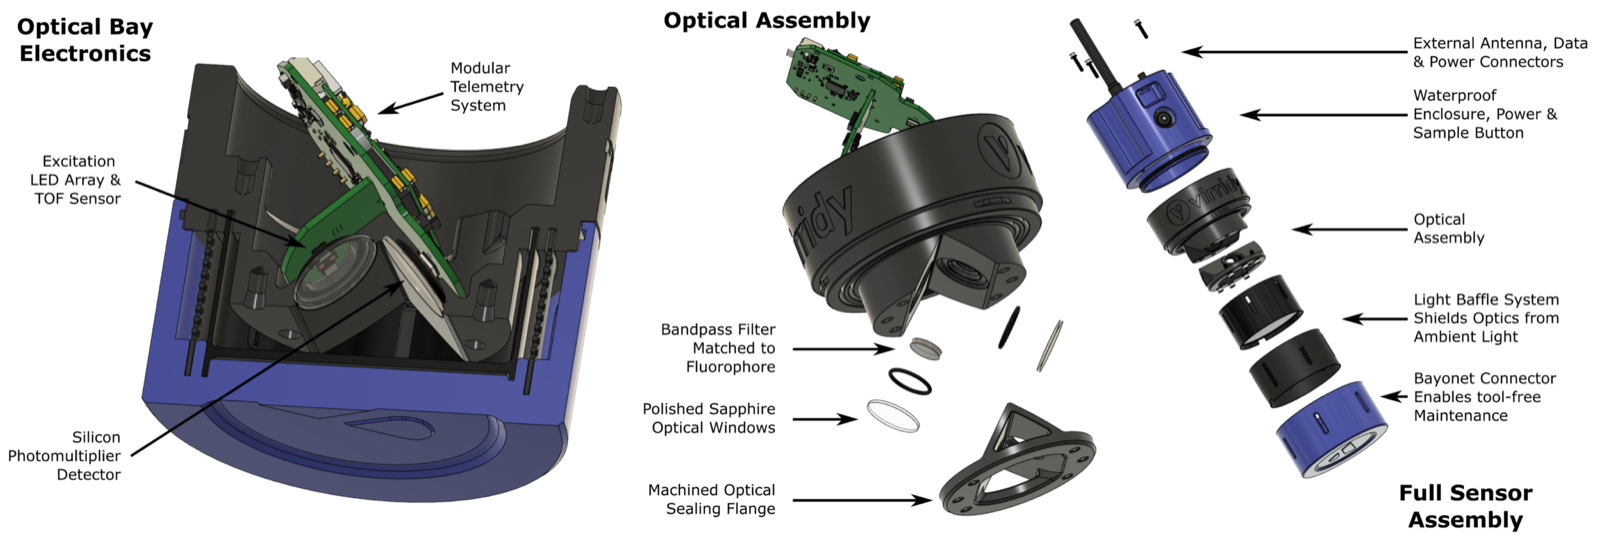
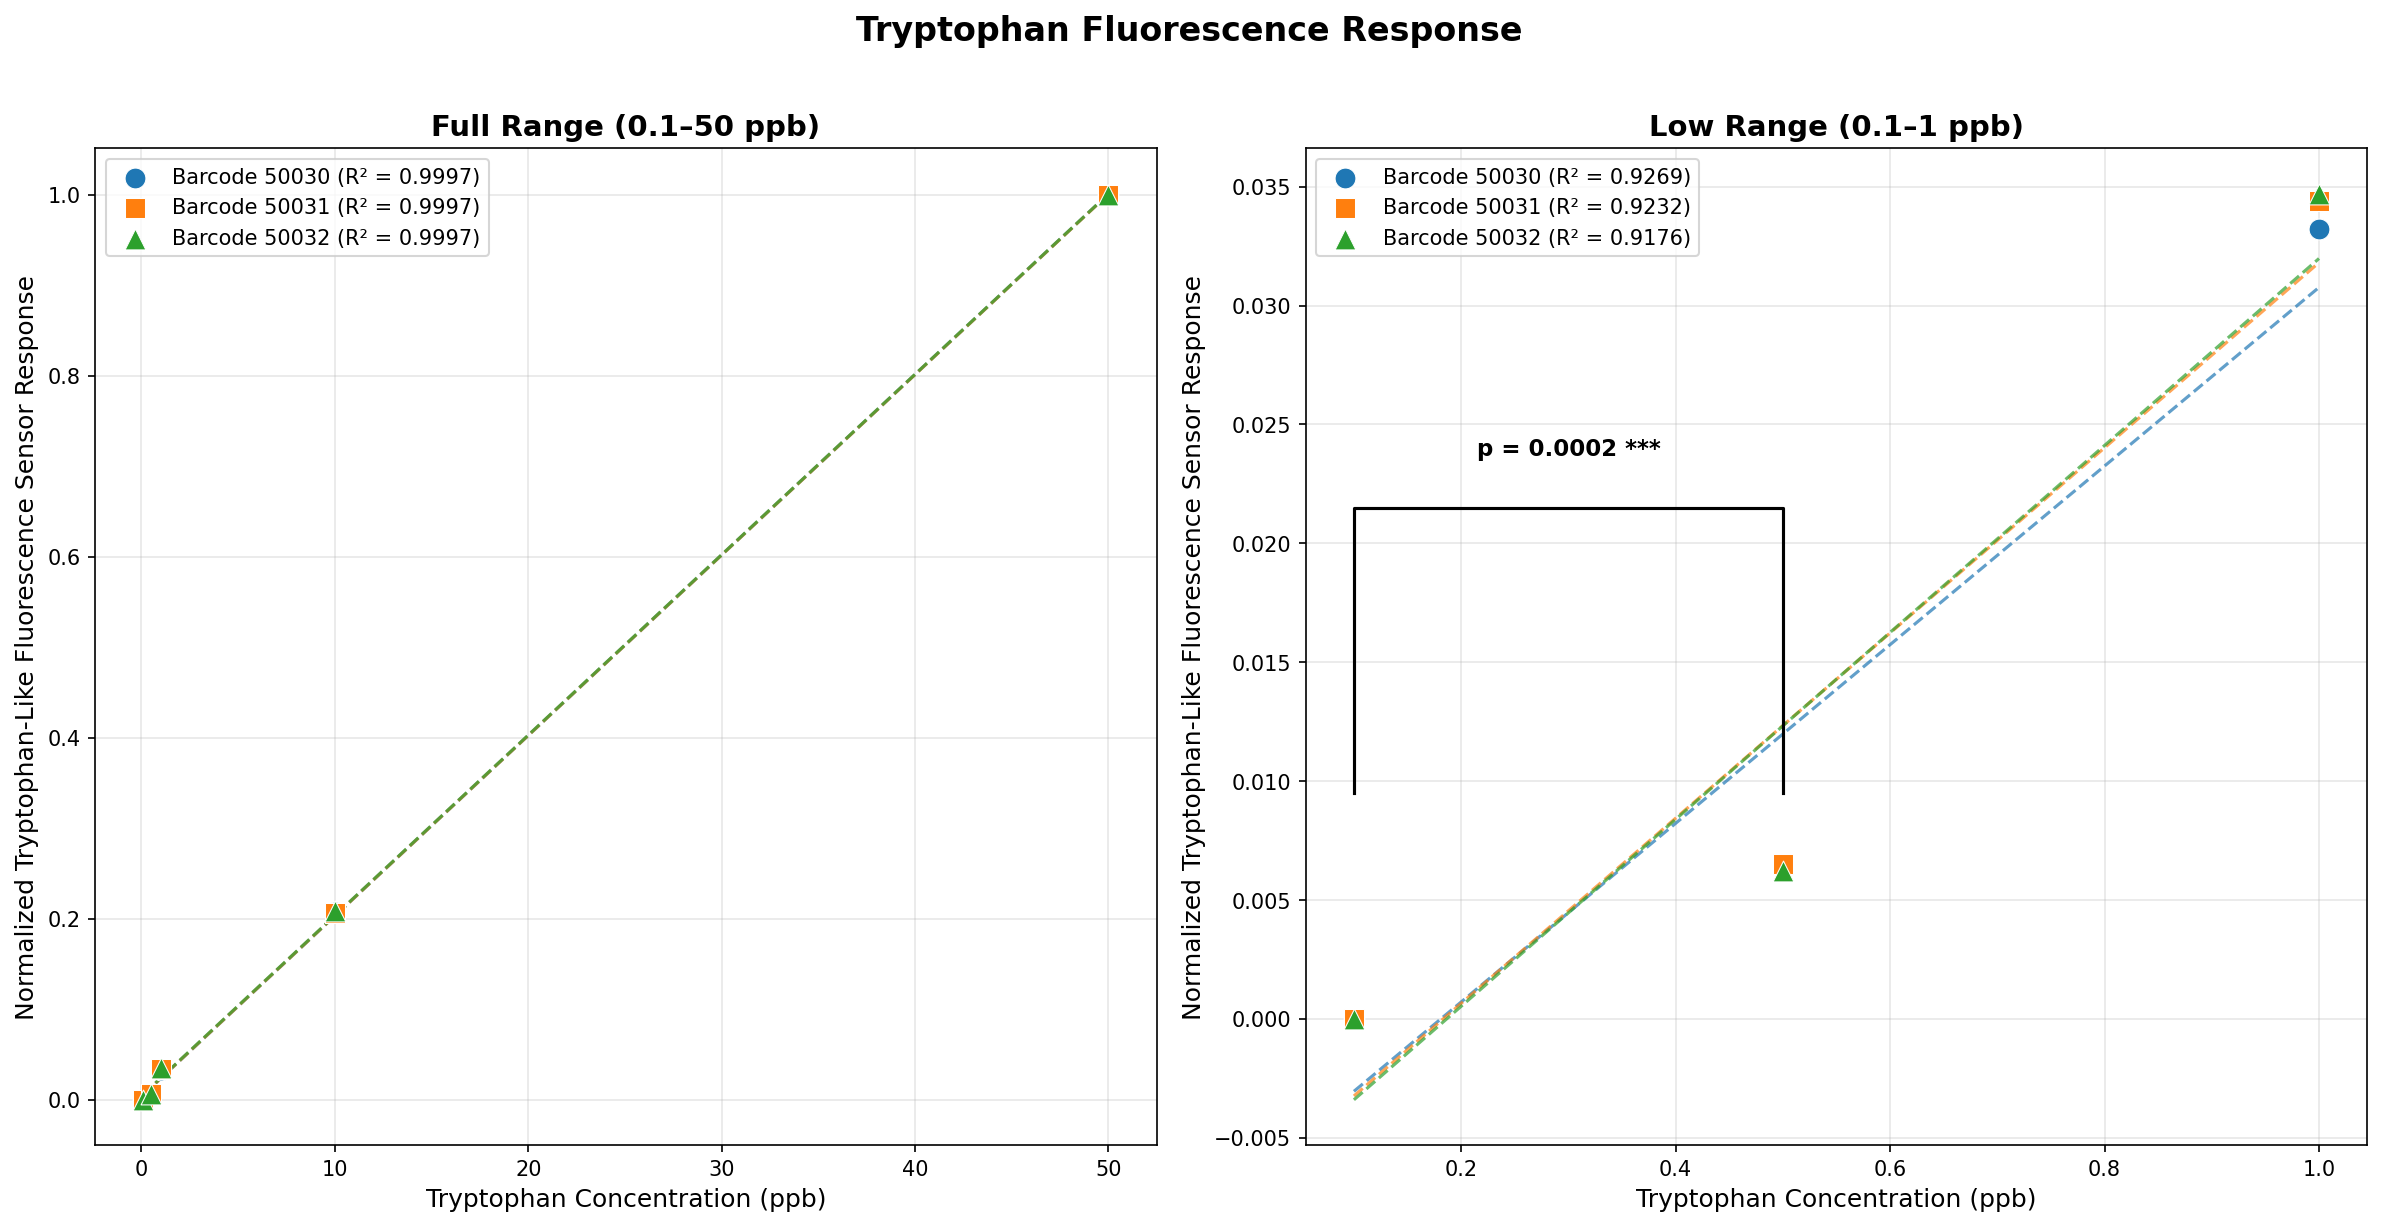
A UV LED excites the water through a sealed optical window and a silicon photomultiplier reads the emitted fluorescence. Each reading sweeps LED power and detector gain, which widens the range one unit can read. The ToF channel measures light scattered back from particles, which gives turbidity and also tells the model when the window is fouled or out of the water. Three units read 0.1 and 0.5 ppb tryptophan as distinct (paired t-test, p = 0.0002) and responded linearly from 0.1 to 50 ppb with R² of about 0.98 on each unit. Two widely used commercial in-situ TLF fluorometers state minimum detection limits of about 3 ppb [1].
How a reading becomes an E. coli estimate
Hand-held: a linear regression on one reading
For recreational water the estimate is fitted by ordinary least squares for each unit u on the unit's own channels [3]:
where F is the fluorescence signal referenced to clean water, T the water temperature and B the turbidity channel. For drinking water, where most samples hold no culturable E. coli and the CBT reads no higher than 100 MPN/100 mL, the regression is a Tobit model, which treats results at that ceiling as censored. Its inputs are the temperature-corrected fluorescence relative to the same unit's clean-water reading that day, the log ratio of ToF to the clean-water ToF, temperature minus 20 °C, and the product of fluorescence and temperature. The coefficients are shared by every unit; the only calibration a unit receives is that daily clean-water reading [2].
In-situ: an hourly nowcast
The base layer is a prior on each site's level, formed from the site's own laboratory record by empirical-Bayes shrinkage (a site with few samples borrows its level from the fleet) and from satellite precipitation. The sensor layer adds the fluorescence channel as its current value, as trailing means, maxima and rates of change over 6 to 72 hours, and as an anomaly against a two-week clean-water reference, together with turbidity and temperature. The output is a log10 concentration with a calibrated spread, and the call is the probability that the water exceeds the jurisdiction's action limit [3]. Each hour, for each site, several models publish such an estimate:
- Prior only: rainfall and the site's laboratory history, with no sensor input.
- Prior plus sensor: the same prior, corrected by the Lume's TLF, turbidity and temperature and by rainfall and streamflow.
- Site refit: a sensor-only regression on that site's laboratory results, refitted at every new result.
- Dashboard model: the regression the customer dashboards display, below.
Every laboratory grab is scored once, against what each model published at the grab's sample hour, before the result was known, and the score is written to a log that cannot be edited. Each site is then served by the model with the lowest decision cost on its own scored record, where a missed exceedance costs three false alarms (five on the Seine and Marne, at the cities' request). A site needs eight scored grabs before its own record decides; until then its region's record does, and a new site holds its alarm until its first laboratory result. If a sensor goes dark the site falls back to the prior-only model with wider uncertainty and keeps any standing alarm. Because no prediction is scored on data it was trained on, the nowcast figures are out-of-sample.
The dashboard model is a linear regression fitted for each deployment, with an intercept for each sensor, refitted as grabs accumulate:
It raises an alert when the estimate reaches a decision cut chosen for each deployment against its action limit.
Recreational water
Hand-held, laboratory grabs
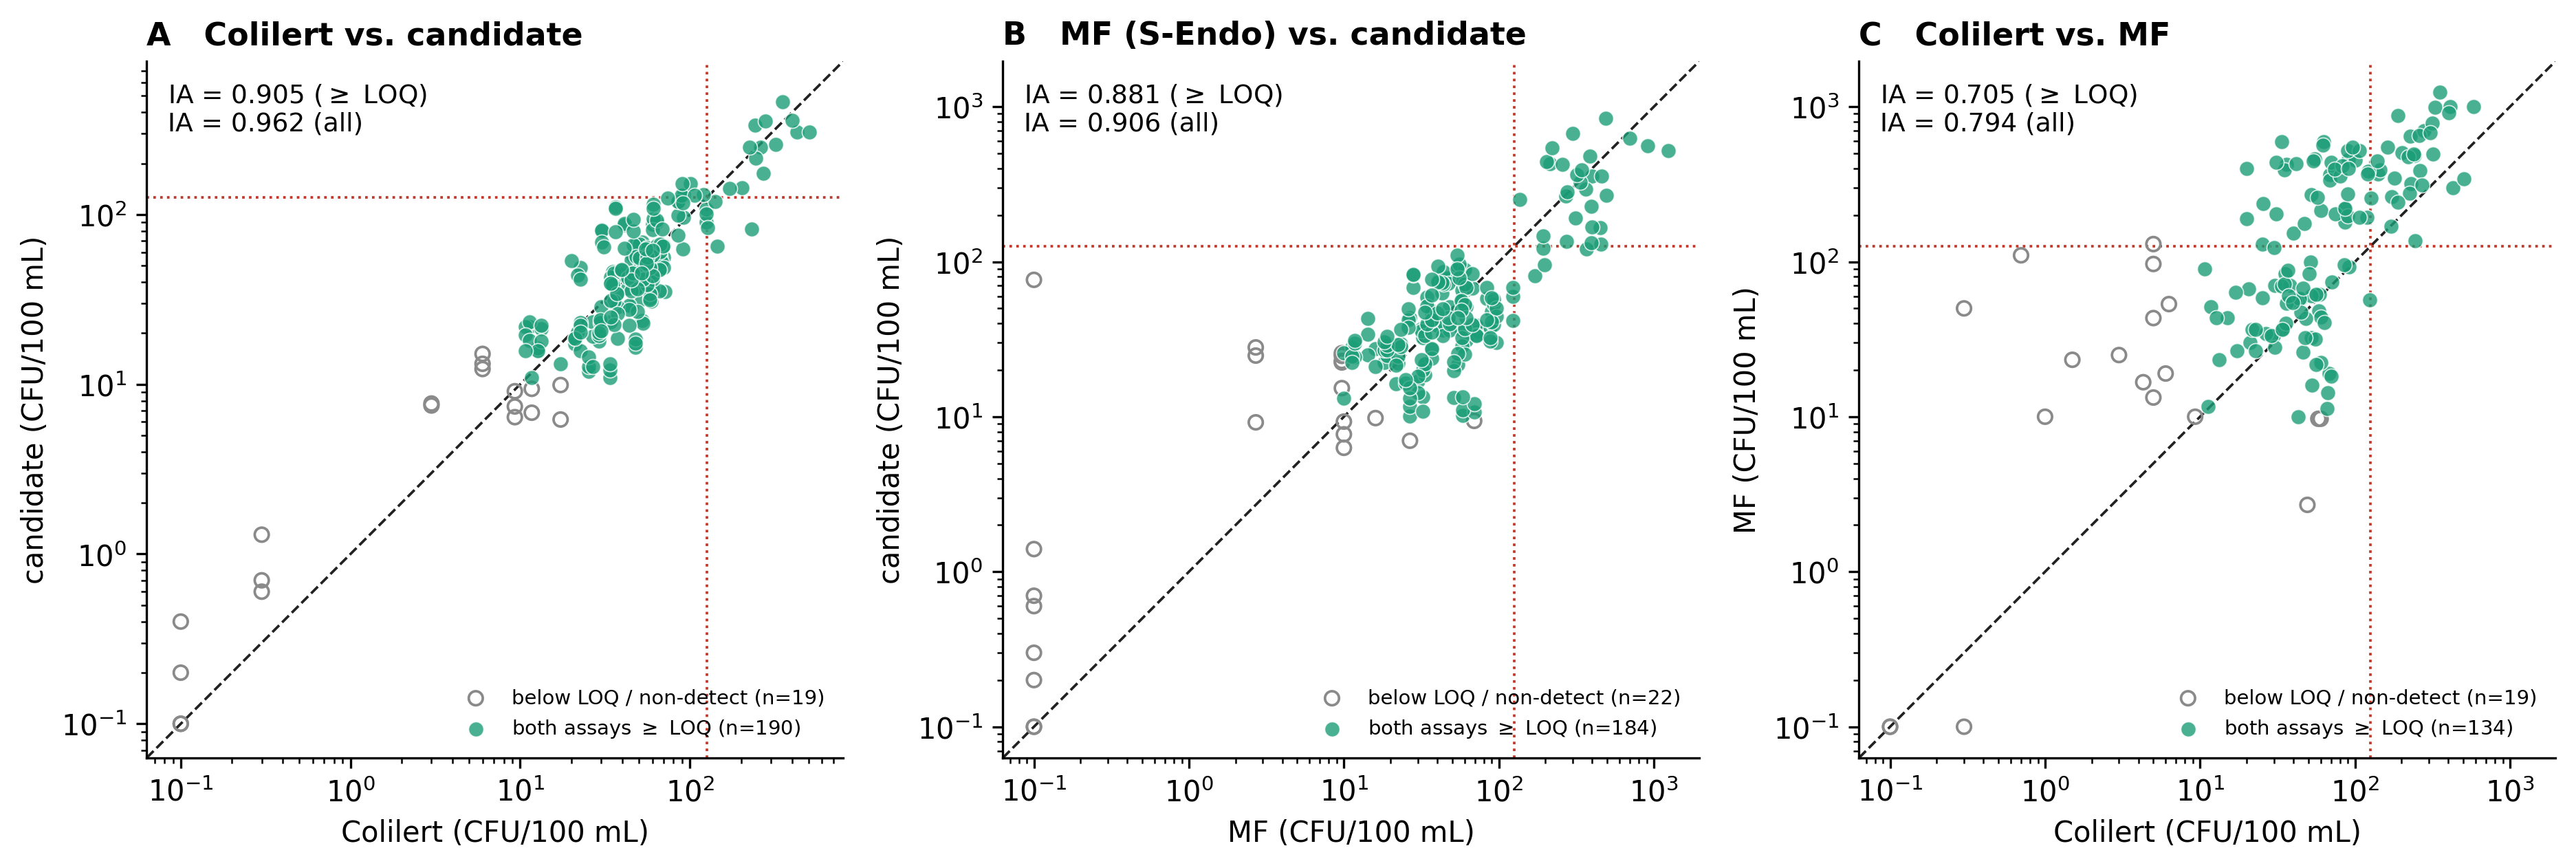
On grabs read in the laboratory the Lume agreed with Colilert at an index of agreement of 0.91 (n = 190) and with membrane filtration at 0.88 (n = 184). The two culture methods agreed with each other at 0.71 (n = 134) [3]. At Boulder Creek's 126 CFU/100 mL limit, with a decision cut of 82, the estimate flagged 16 of 17 exceedances and cleared 165 of 192 grabs below the limit: sensitivity 94%, specificity 86%, balanced accuracy 90% (n = 209, in-sample). Sorted into three bins (under 10, 10 to 100, over 100 MPN/100 mL), 91% of bench grabs were classified correctly, with balanced accuracy 0.77 across the bins [1].
In-situ, hourly nowcast (out-of-sample)
Loading the decision log…
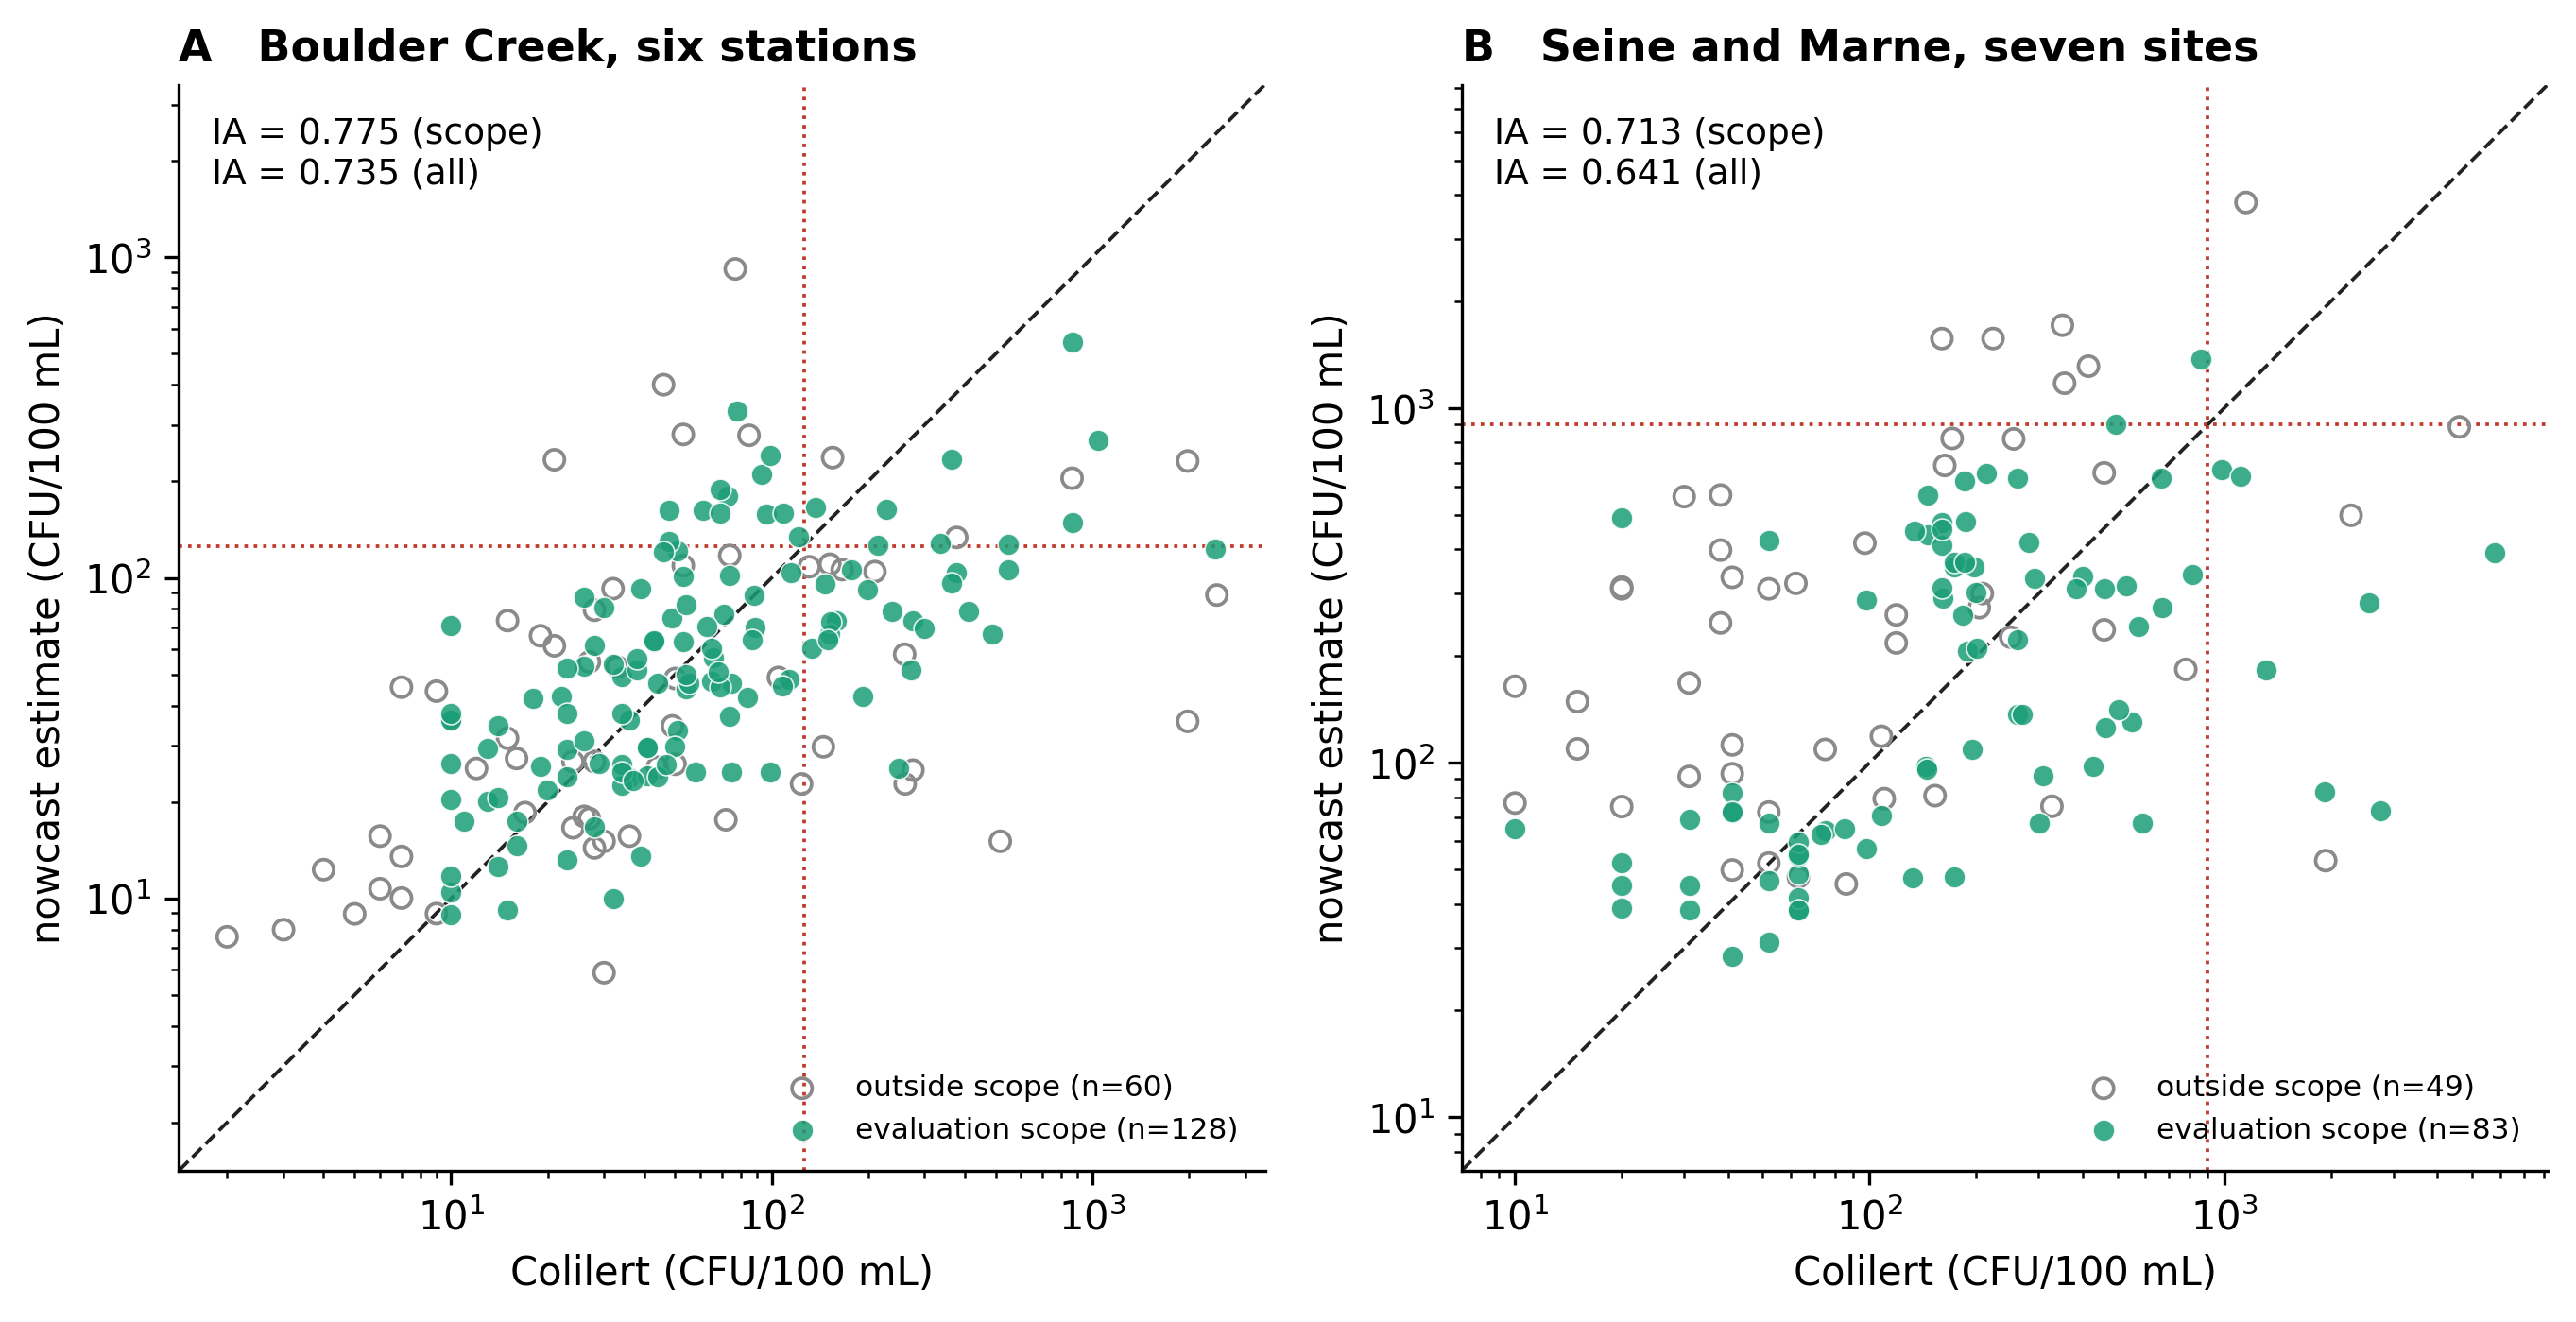
Each program is scored at its own action limit. Grabs taken before a site had any earlier result are left out, as the gate leaves them out. Index of agreement uses grabs within the Colilert range.
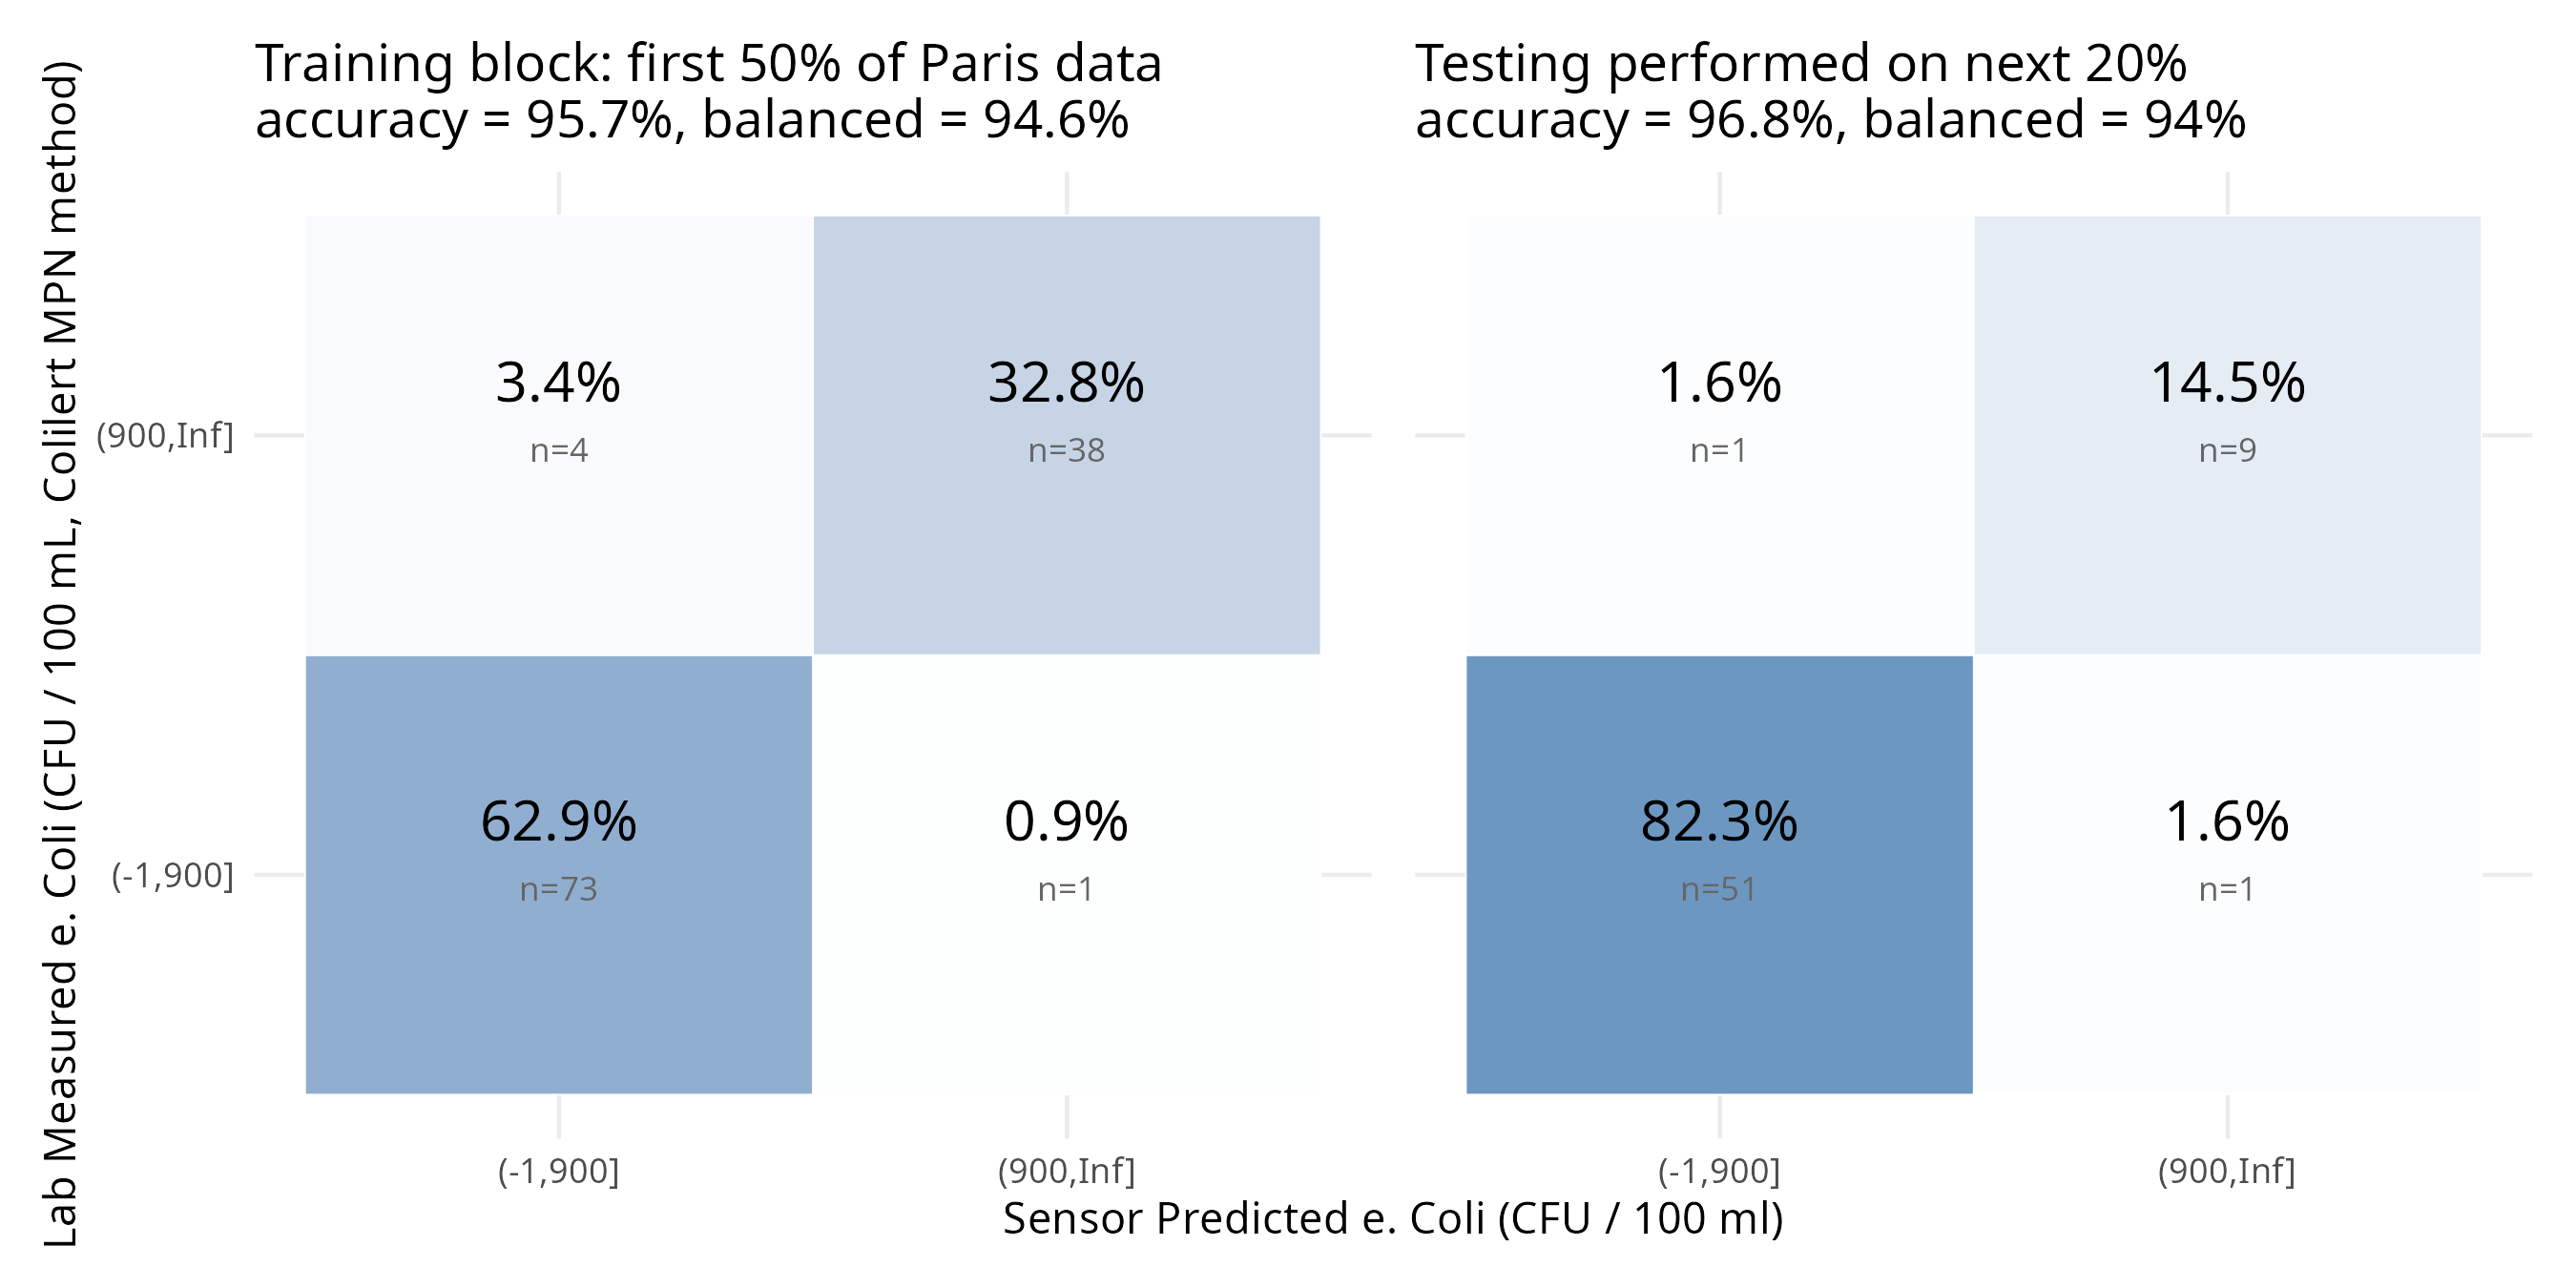
The method paper froze this log at an earlier date and scored it within the method's stated operating scope: index of agreement 0.78 at six Boulder Creek stations (n = 128, 29 exceedances) and 0.71 on the Seine and Marne (n = 83, 7 exceedances) [3]. On the Paris deployments, a time-blocked evaluation that trained on the first half of the record and tested on later data classified 96.8% of test samples correctly at 900 CFU/100 mL, balanced accuracy 94% [1].
In-situ, every grab against the dashboard estimate (in-sample, live)
Every Colilert grab on file for an installed sensor, paired with the hourly estimate the customer dashboard stored for that sensor within 60 min of sampling. An exceedance is a grab at or above the deployment's action limit; the estimate alerts at or above the decision cut. Agreement uses log10(MPN/100 mL) with non-detects entered as 1 and grabs above the Colilert range left out. The served coefficients were fitted on many of these grabs, so these figures are in-sample.
Each point is one grab, colored as in the table. Triangles are grabs above the Colilert range, plotted at 2,419.6. Dashed line 1:1.
Grabs received per week, and why some did not pair
Every grab
Drinking water
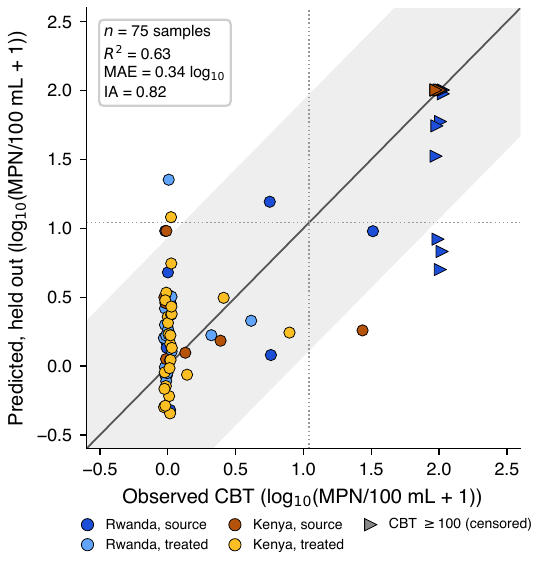
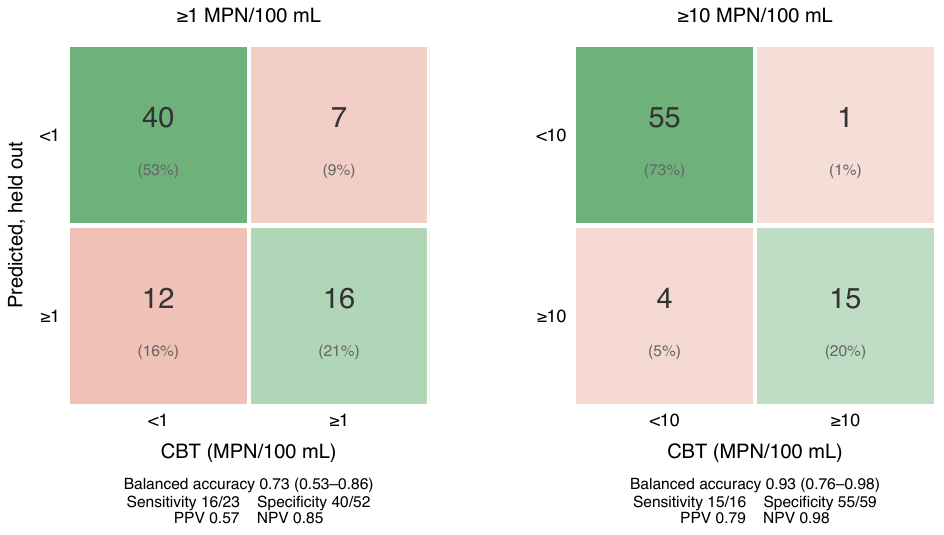
Three units read 110 CBT records from 75 samples of source and treated water in two drinking-water programs in Rwanda and Kenya, —. Every prediction came from a model fitted without that sensor and without that sampling day, the situation of a new sensor on a new day. At the WHO threshold of 10 MPN/100 mL the Lume detected 15 of 16 samples at or above it and classified 55 of 59 below it correctly (balanced accuracy 0.93, 95% CI 0.76 to 0.98). The Lume agreed with the CBT on 70 of 75 samples; repeat CBTs of the same water agreed with each other on 36 of 38. All 30 chlorinated records read CBT 0, and the Lume classified all of them below 10. Calibrating each unit against CBT results did not improve on the daily clean-water reading, and removing the turbidity input lowered balanced accuracy to 0.72. With 16 samples at or above 10, the sensitivity estimate is imprecise [2].
Drinking and recreational water compared
| Drinking water | Recreational water | |
|---|---|---|
| Decision threshold | 1 and 10 MPN/100 mL (WHO risk categories) | 126 to 900 CFU/100 mL, set by the jurisdiction |
| Concentrations in these records | Most samples under 10; all 30 chlorinated records read zero | Tens to thousands per 100 mL |
| Reference | CBT, reads to 100 MPN/100 mL | Colilert, to 2,419.6 MPN/100 mL undiluted; membrane filtration |
| Configuration | Hand-held at the water point | Hand-held, and in-situ with an hourly nowcast |
| Model | Tobit regression, coefficients shared by all units, daily clean-water reading | Linear regression per unit (hand-held); site prior plus sensor layer (in-situ) |
| Strongest result | Screening at 10 MPN/100 mL: balanced accuracy 0.93, held out | Agreement with both culture methods: 0.91 and 0.88 |
| Weakest point | The 1 MPN/100 mL call (balanced accuracy 0.73), and few positive samples | Low concentrations, and sites where fouling or storm particles move the optics |
In drinking water the decision is at 1 or 10 MPN/100 mL and most samples hold none, so the sensor works near its lower limit and the reference reads few positives. The screen at 10 is the stronger result. In recreational water the limits are 126 to 900 CFU/100 mL, and the in-situ configuration supplies an estimate every hour between grabs.
Turbidity
The ToF channel reports in counts. Turbidity is the rise above that unit's own clean-water count, times 1.25 NTU per count; the clean-water count differs from unit to unit and has to be measured on each. On formazin standards (unit 50031) and on a wastewater dilution read with a laboratory turbidimeter (unit 50056), the converted readings matched the reference with an RMS error of 1.0 and 1.1 NTU from 0 to 20 NTU. Above 20 NTU the conversion reads low: by 10 to 14% at 72 and 91 NTU of wastewater, and by 30 to 40% at 59 and 109 NTU of formazin. In a 36-unit barrel dosed in three steps up to 7.2 NTU, 31 units rose at every step and the per-unit response was linear (median R² 0.98 against the dose).
In rivers the channel is better read as an event indicator. Against 28 portable-turbidimeter grabs on the Chicago River system, the rise over each unit's seven-day floor correlated with turbidity at a rank correlation of 0.32 (p = 0.09), driven by one storm; the two Calumet sites tracked turbidity (0.68 and 0.60) and North Branch and South Branch did not. Fouling between cleanings moved the floor by more than the whole bench range. Storm water raised the signal far beyond what the portable meter read. The full record is on the turbidity page.
Wastewater
Unit 50056 was read in raw municipal wastewater diluted with tap water in eight steps from 0 to 100%, alongside a benchtop excitation-emission fluorometer, a commercial in-situ TLF fluorometer and a laboratory turbidimeter (San Diego State University Water Quality Laboratory, 20 May 2026). The ToF channel tracked the laboratory turbidity across all eight steps, 0 to 91 NTU, at R² 0.99. Fluorescence rose with wastewater content up to 25% (R² 0.86 against the benchtop fluorometer over 0 to 25%) and then stopped rising; the commercial fluorometer also stopped rising at 25% and fell at 100%. In strong wastewater the Lume therefore reports a high organic load and the turbidity channel carries the concentration information. Colilert grabs on the same dilution series were not proportional to dilution: the 10% sample read 1,200 MPN/100 mL, about a thousand times below what the 100% sample (12,997,000) implies. The full record is on the wastewater page.
Limits of these results
- The bench detection limit differs by unit, from 4 to 43 CFU/100 mL equivalent; every unit clears 200. In the field the signal first separates from chance at about 100 CFU/100 mL (daily-calibration test).
- Opening or handling a unit adds a small step to its zero for several hours, so the clean-water zero and the sample must be read in the same handling state (drift findings).
- The hand-held recreational figures and the dashboard figures are in-sample. The nowcast and CBT figures are out-of-sample.
- —
- Co-located units differ by about 0.16 log10, more than the culture reference's own precision of roughly 0.03 to 0.10 log10. Single Boulder Creek stations score an index of agreement of 0.44 to 0.66 on 23 to 34 pairs; the 0.78 result belongs to the six stations together [3].
- No marine data yet: enterococci (Enterolert) pairing for saltwater has not started.
- The Paris laboratories also report a microplate method; those grabs are shown under their own method and are not counted as Colilert.
Sources
- Knopp W, Klaus J, et al. Advancing continuous in-situ quantification of microbial contamination in environmental waters using tryptophan-like fluorescence: sensor design and validation. Water Research 302:126099 (2026).
- Knopp W, Ecklu J, et al. Field validation of a tryptophan-like fluorescence sensor against the compartment bag test for microbial drinking water quality in rural water treatment programs in East Africa. Water Research X, under revision.
- Thomas E, Ross MRV, Vlah MJ, et al. A method for tryptophan-like fluorescence as an alternative fecal indicator in natural waters. ES&T Water, submitted.
Live sections read the inventory API: /api/validation/paired (every grab against the
dashboard estimate, re-paired hourly) and /api/nowcast/decisions (the nowcast's scoring log). New
grabs arrive through the hourly mWater and Chicago syncs and the sample-email ingest, and appear here within the
hour after both the result and the sensor's estimate are in. Times are Mountain time.