dMRV Solution &
Implementation Plan
Digital Monitoring, Reporting & Verification for carbon-financed water treatment programs using Virridy’s Lume sensor
Decision & Approval
Approved Methodology Deviation
Under the Gold Standard dMRV Pilot Programme, Virridy has received pilot-level approval for a methodology deviation allowing the use of the Lume sensor for E. coli estimation in place of traditional laboratory-based sampling. This is a pilot approval — not a fully approved methodology change — meaning the deviation is authorized for evaluation under the pilot framework, subject to resolution of the Forward Action Requirements below and successful completion of the validation and verification process. The deviation applies to the methodology “Emission Reductions from Safe Drinking Water Supply” (Version 1.0), specifically for SDWS Parameter 18 (Microbial Drinking Water Quality).
Forward Action Requirements (FARs)
Four Forward Action Requirements have been raised and must be addressed before the first verification:
FAR 1: Sensor Validation and Calibration Protocols
The project developer must provide detailed protocols for sensor validation and calibration, including frequency of calibration checks, acceptable drift thresholds, and procedures for replacing or recalibrating sensors that fall outside tolerance.
FAR 2: Documentation of AI/ML Implementation and Validation
Full documentation of the AI/ML model used for E. coli estimation must be provided, including training data sources, model architecture, validation results, accuracy metrics, and procedures for model retraining and version control.
FAR 3: Integration of Manual and Digital Processes
A clear protocol must be established for integrating manual water quality sampling with the digital Lume sensor data. This should define when manual sampling is required as a complement or cross-check, and how discrepancies between manual and digital results are resolved.
FAR 4: Exploration of SDWS 23 and SDWS 27
The project developer should explore the applicability of SDWS Parameters 23 and 27 to the dMRV solution and provide a rationale for inclusion or exclusion of these parameters in the monitoring plan.
Next Steps
- CME status update: A status update on the implementation of the dMRV solution is required within 6 months of approval.
- Validation and verification: The project must follow Gold Standard’s submission guidelines for validation and verification, with all FARs resolved prior to the first verification audit.
- Ongoing compliance: The dMRV solution must continue to meet Gold Standard requirements throughout the crediting period, with periodic reviews as specified in the pilot programme guidelines.
The companion Pilot Report (v0.2) compiles the resolved evidence for each Forward Action Requirement, based on 216 paired Lume–CBT field samples from Rwanda (Amazi Meza) and Kenya (DRIP). All four FARs are resolved. Open the Pilot Report & FAR Resolution Evidence →
Summary
The proposed dMRV solution integrates Virridy’s Lume sensor into a Safe Drinking Water Supply (SDWS) project — demonstrated in the team’s institutional water treatment project in Rwanda — to remotely and continuously monitor treatment-system operation and estimate treated water quality. By deploying a network of IoT-enabled fluorescence sensors at the point of consumption, the system provides near-real-time, high-resolution data on microbial drinking water quality (E. coli risk), replacing or augmenting traditional periodic manual sampling with automated, cloud-based reporting.
This dMRV approach digitizes critical aspects of water system use and water quality monitoring, making manual and periodic water sampling more cost effective and efficient with continuous, automated assessments. It also improves the verifiability and transparency of monitoring data, supporting compliance with Gold Standard certification requirements.
While microbial water quality is the central focus of this dMRV implementation, the plan also includes exploration of two additional measurement parameters enabled by the Lume system: monitored quantity of safe water treatment and estimated days of operation of the water treatment system.
Project Background Information
Scope
The objectives of this project are: (i) Schools from rural communities have access to safe water and (ii) CO₂ emissions are avoided. This project will address critical access to safe water, whilst contributing to the avoidance of greenhouse gas emissions from the boiling of unsafe water.
Proposed Solution
Overview of the dMRV Solution
The proposed dMRV solution integrates Virridy’s Lume sensor into a Safe Drinking Water Supply (SDWS) project — demonstrated in the team’s institutional water treatment project in Rwanda — to remotely and continuously monitor treatment-system operation and estimate treated water quality. By deploying a network of IoT-enabled fluorescence sensors at the point of consumption, the system provides near-real-time, high-resolution data on microbial drinking water quality (E. coli risk), replacing or augmenting traditional periodic manual sampling with automated, cloud-based reporting.
Scope of dMRV Solution Application
The primary challenge addressed by this dMRV solution is the lack of continuous, objective, and easily verifiable monitoring of microbial drinking water quality in carbon-financed water treatment programs.
Although the microbial water quality of treated water is not typically expected to indicate contamination, the absence of high-resolution data reduces the ability to validate performance over time. Conventional monitoring relies on infrequent grab samples that may not capture variability in treatment performance or contamination events.
This challenge is especially pronounced in household and institutional water treatment (HWT/IWT) programs like those in Rwanda, where water can be contaminated post-treatment due to improper use, filter degradation, or environmental factors. Without continuous data, it is difficult to provide high-confidence assurance that treated water consistently meets safety standards.
To close this gap, the proposed dMRV solution deploys Virridy’s Lume sensor to digitally monitor microbial water quality at the point of consumption. The approach is treatment-technology-agnostic: the same sensor and protocol monitor microbial water quality (and treated-water presence) at the point of consumption for any SDWS safe-water supply — filtration, chlorination, borehole, or piped distribution — with the Amazi Meza filtration program serving as the Phase 1 demonstration rather than a constraint on applicability.
Scope of MRV Activities Digitized
- Monitoring: Continuous sensor estimates of microbial drinking water quality, treatment-system use and volume estimates.
- Reporting: Automated data upload, cloud-based dashboards, and time-stamped digital records of water safety performance.
- Verification: Transparent, auditable digital datasets to support third-party validation and verification.
By digitizing these MRV components, the solution provides a higher level of assurance that users are consistently receiving microbiologically safe water, reinforcing the validity of GHG reduction claims tied to the displacement of boiling.
dMRV Solution Application
The proposed dMRV solution leverages the Lume sensor to continuously estimate E. coli contamination at the point of consumption (the treated water from the project’s safe-water supply, such as a filtration or chlorination system) and transmits data via cellular networks to cloud-based dashboards for reporting and auditing.
Digitized MRV Activities
The dMRV solution digitizes the monitoring, reporting, and partial verification components of the MRV framework. Sensor technology captures microbial water quality and water system uptime metrics, while cloud platforms handle data aggregation, analysis, and structured reporting for project developers and verifiers.
Data Collection and Management
The Lume device collects microbial water quality data continuously in the safe-water storage of the treatment system (for example a gravity filter, a chlorination dispenser, or a treated-water tank). In some cases, the Lume will also collect data on the untreated water source. Data is stored locally on the device and transmitted over cellular networks to a secure cloud platform for aggregation and analysis.
Data Analytics and Automation
Raw data collected by the Lume sensor undergoes processing in a right-censored linear regression (Tobit model). The model outputs quantification and prediction error of E. coli contamination risk aligned with WHO risk classifications. Automated dashboards present key metrics in real time, with alerts triggered for anomalies such as elevated contamination or extended sensor inactivity.
Standardized Reporting
The system generates standardized reports summarizing microbial water quality performance (E. coli risk category in CFU/100mL) over defined intervals (e.g., daily, weekly). These reports are accessible via the cloud platform and can be exported for inclusion in Gold Standard monitoring and verification documentation.
Key Technologies & Methodologies
The dMRV solution integrates multiple digital technologies to enable continuous, accurate, and verifiable monitoring of microbial drinking water quality.
Data Collection Technologies
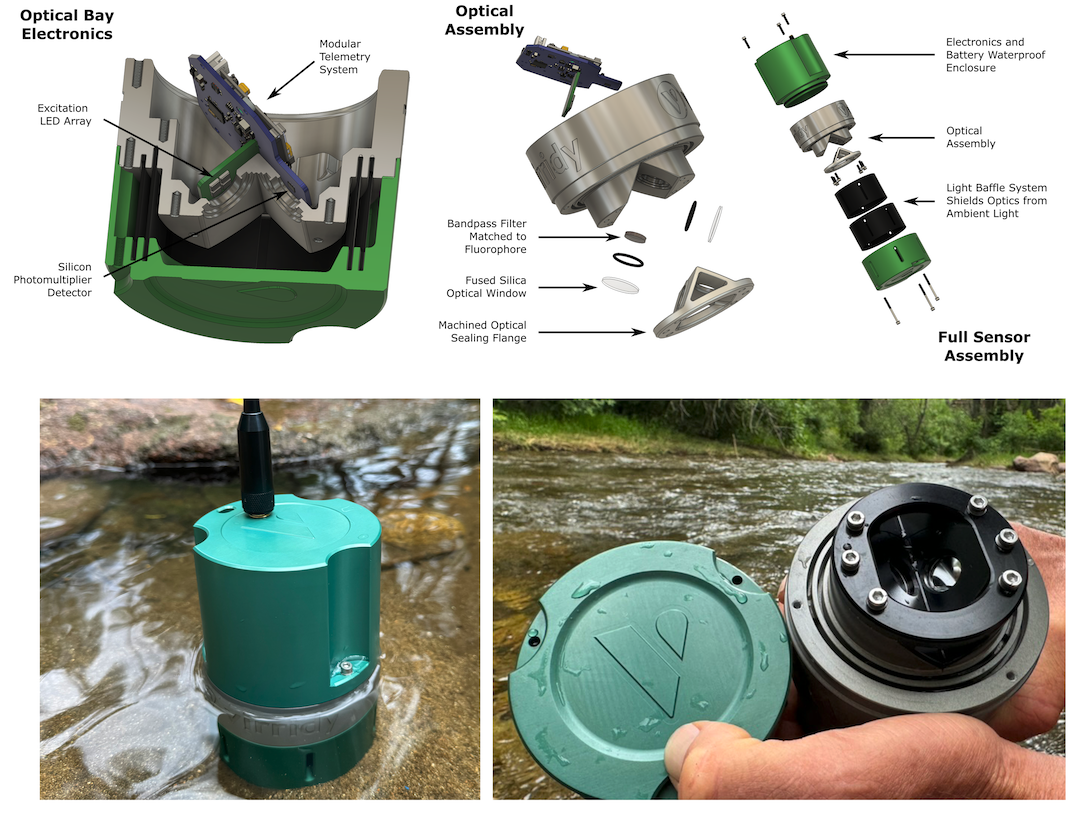
The core data collection technology is an Internet of Things (IoT) sensor, the Lume, developed by Virridy. The Lume is a fluorescence sensor, measuring tryptophan-like fluorescence (TLF) at 273/350 nm excitation/emission wavelengths (Knopp et al., Water Research 302, 2026). TLF is a biological marker correlated with microbial activity and fecal contamination across groundwater, surface water, estuarine, and urban watershed environments globally. A right-censored linear regression (Tobit model) estimates E. coli contamination from fluorescence and turbidity data. The sensor also includes integrated turbidity and temperature sensors as well as a water presence detector to monitor system uptime and infer treatment volumes.
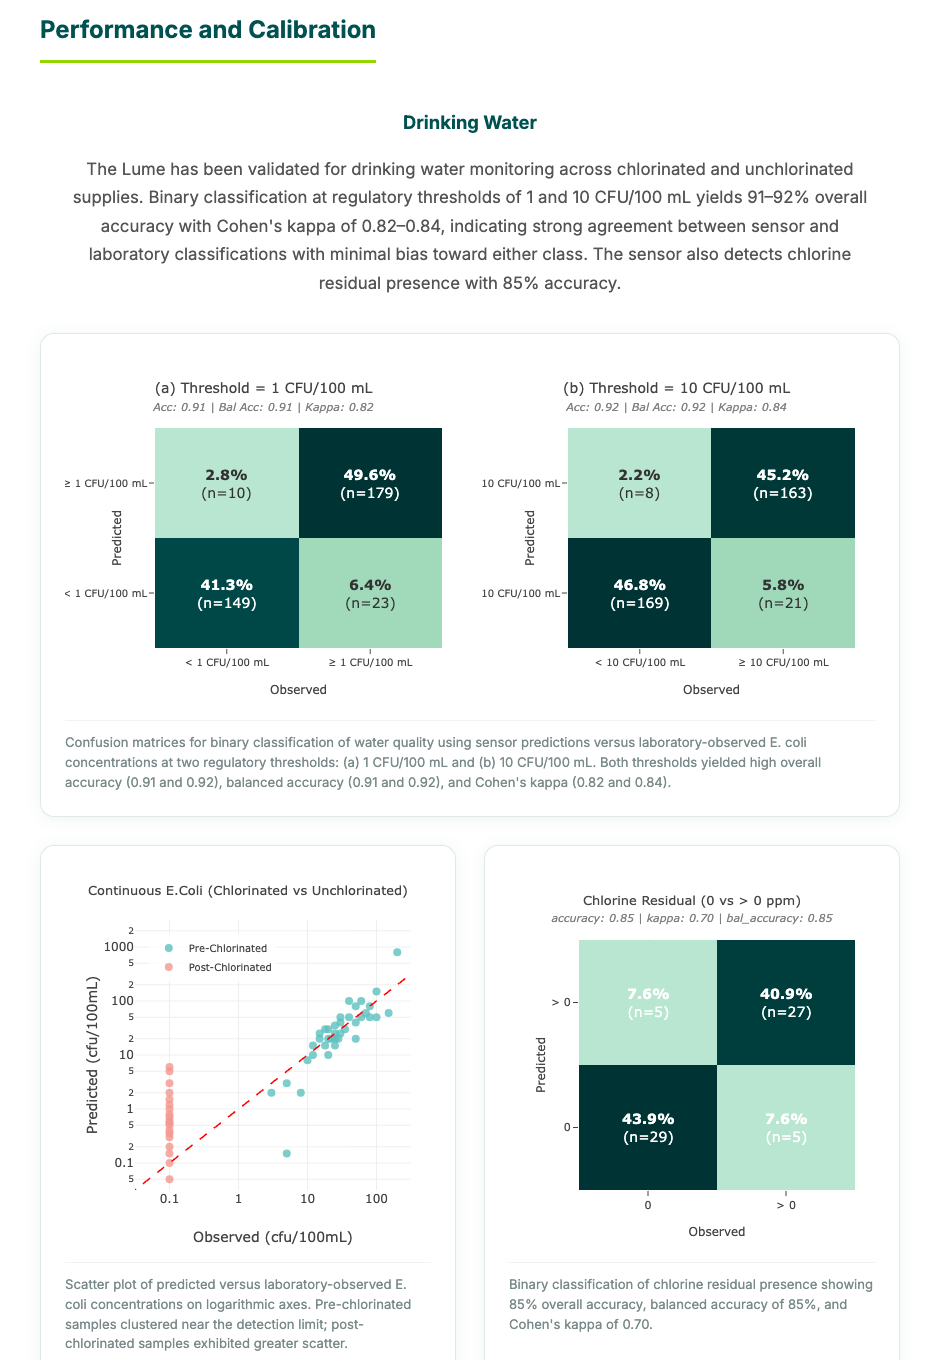
Validated Performance (CBT Field Calibration)
Data Processing and Analysis Tools
Data collected by the sensor is processed using a transparent right-censored linear regression (Tobit model). The estimation pipeline uses baseline-subtracted raw fluorescence (mon2), water temperature, and the baseline-subtracted turbidity proxy (tof), together with a per-sensor 2-point calibration (offset + gain: per-sensor intercept offsets and per-sensor fluorescence slopes), for a total of 8 parameters. Temperature is included as an explicit model predictor rather than applied as a fixed pre-correction. There is no AI, no machine learning, no black-box inference — the model is a fully auditable closed-form regression specified entirely by 8 published coefficients that any third party can reproduce.
CBT Field Validation
The model was trained and validated against 216 paired Lume–CBT field samples from 3 sensors deployed across Rwanda (Amazi Meza) and Kenya (DRIP). Leave-one-out cross-validation (LOOCV) achieved 88% agreement within ±0.92 log10 of the CBT reference, with 85% balanced accuracy at the ≥10 CFU/100 mL threshold when the deployed Tobit is thresholded directly (sensitivity 76%, specificity 93%, AUC 0.892), or 83% with a class-balanced logistic classifier (sensitivity 84%, specificity 82%, AUC 0.885). Per-sensor performance: 50045 85%, 50053 98%, 50065 85%; by program, Kenya (DRIP) 93% and Rwanda (Amazi Meza) 82%, the latter reflecting naturally fluorescent dissolved organic matter in Rwandan source waters rather than a sensor defect.
Cloud Computing for Data Storage and Accessibility
All sensor data is transmitted to a secure cloud-based data platform that stores, aggregates, and organizes information by device, location, and time period. The platform provides secure, role-based access for project developers, verifiers, auditors, and other stakeholders.
Known Limitations
Performance is influenced by dissolved organic carbon (DOC), humic-like fluorescence, turbidity, and temperature; high-DOC source waters (e.g., some Rwandan springs) raise the tryptophan-like-fluorescence baseline and account for most residual error, with best performance in low-DOC waters. The ≥10 CFU/100 mL risk threshold is validated against CBT across two countries (88% LOOCV agreement; 85% / 83% balanced accuracy at the deployed-Tobit and logistic operating points); extension to water types outside the validated envelope follows the §2.4 retraining protocol.
Technology Maturity Level
The technology has been prototyped, validated in the lab and deployed in various field conditions, including the application for the proposed dMRV application. It is around level 7 on the TRL scale.
This TRL level supports deployment across a significant portion of the market, especially in contexts requiring reliable, continuous, and remote monitoring of water systems. The system’s design is adaptable to other water project types (e.g., household water treatment, community water supply).
The solution incorporates mature digital data collection capabilities, including:
- Cloud-based platforms for real-time data transmission, storage, and visualization
- Use of mobile and internet connectivity to support remote deployments
- Integration with backend data management systems to support project monitoring, analytics, and reporting
Additionally, the dMRV solution leverages advanced technologies to enable “smart” operations, including:
- Automated sensors for microbial water quality, flow, and system uptime
- IoT systems paired with regression-based analytics support remote diagnostics, performance alerts, and predictive insights
- Performance-based incentives for water safety and service delivery
- Adaptive management based on real-time data
- Reduced travel-related emissions through remote monitoring
Digitization & Automation of MRV Activities
Scope of Digitization
The dMRV solution applies to a specific subset of material GHG sources. Specifically, greenhouse gas emissions avoided through the consistent delivery of microbiologically safe drinking water that displaces the need for boiling.
Automation Level
The following MRV processes could be automated:
- Water quality monitoring: Lume sensors automatically assess microbial contamination using tryptophan-like fluorescence.
- Data transmission: Sensor readings are sent in near real time to a centralized cloud platform via cellular networks.
- Data analysis: Embedded regression algorithms classify contamination status.
- Reporting: Automated dashboards present time-stamped performance data for remote review.
These MRV processes still require human intervention:
- Sensor installation and calibration: Initial deployment and periodic maintenance require technician support.
- Quality assurance: Manual water sampling may still be used periodically for calibration and validation purposes.
Data Flow
- Collection: The Lume autonomously collects data on microbial water quality from the filter safe water container.
- Transmission: Data is transmitted over mobile networks to a secure cloud-based platform.
- Processing: On the platform, data are automatically cleaned, time-stamped, and analyzed using the pre-trained estimation model.
- Storage: Results are securely stored in a structured database, organized by device, location, and date.
- Reporting: Dashboards and downloadable reports provide accessible summaries for project developers, auditors, and Gold Standard reviewers.
Digital Technologies Integration
Lume Sensor
The digital technologies integrated into the dMRV solution include a physical IoT sensor device paired with a transparent estimation model that reports estimated E. coli contamination risk in near real time.
The Lume sensor is the key hardware component of the dMRV system. It is an IoT fluorescence-based E. coli sensor that can also estimate treatment-system use and treated-water volumes with a water presence sensor. Data gathered directly by the Lume sensor is transmitted to a remote and secure cloud-based data platform for processing with the estimation model.
Estimation Model
The estimation model is the primary software in the dMRV system. It uses a right-censored linear regression (Tobit) to estimate E. coli concentration from raw sensor data. Input features are baseline-subtracted raw fluorescence (mon2), water temperature, and the baseline-subtracted turbidity proxy (tof), together with a per-sensor 2-point calibration (offset + gain: per-sensor intercept offsets and per-sensor fluorescence slopes); temperature is an explicit predictor rather than a pre-correction. The model is fully specified by 8 coefficients — no AI, no decision trees, no ensemble methods, no black-box inference.
Model outputs are pulled into a dashboard that provides water quality data to accrediting agencies, municipalities, implementing partners, and other stakeholders. The system requires no consumables or lab infrastructure, enabling autonomous continuous monitoring at significantly lower operational costs than traditional methods.
Intellectual Property
The dMRV solution is protected by two issued U.S. patents:
- US Patent 11,506,606 B2 — Adaptive contamination detection
- US Patent 11,507,861 B2 — Automated system-state classification
Extent of MRV Digitization
Fully Automated MRV Processes
Microbial Water Quality Monitoring (SDWS 18)
This parameter is fully digitized, potentially replacing or at minimum increasing the efficiency and cost effectiveness of manual, periodic water quality testing. The Lume sensor captures near real time microbial quality measurements at the point of consumption, transmitted to a cloud platform for automatic analysis and reporting.
Partially Digitized Activities
Project Technology Operation Days (SDWS 27)
Lume includes internal water presence / absence sensors that can infer operational days based on system activity. While the sensor can autonomously estimate uptime, a more extensive field deployment will be needed to validate the accuracy and reliability of this method before it can be considered fully digitized.
Safe Water Quantity Monitoring (SDWS 23)
This parameter is being evaluated as part of the dMRV plan. While the Lume may be able to track water flow events and link them to microbial safety data, further development is needed to validate volume estimation accuracy.
System Calibration and Maintenance Logs
While routine maintenance and calibration are supported by automated alerts and diagnostics from the sensor, the actions themselves (e.g., cleaning, sensor replacement) are conducted by field technicians and documented manually in digital logs.
Efficiency and Accuracy Improvements from Digitization
- Improved Temporal Resolution: Sampling can occur multiple times per day, vastly exceeding the frequency of traditional manual testing which is typically annually.
- Reduced Human Error: Automated sensing and reporting eliminate data entry and handling errors common in manual processes.
- Near Real-Time Responsiveness: Continuous data enables earlier detection of system failures or contamination events, allowing for rapid corrective action.
- Enhanced Auditability: Time-stamped, tamper-resistant digital records improve transparency and facilitate third-party verification.
Manual Human Involvement
Although the proposed dMRV solution digitizes key monitoring and reporting activities, certain MRV tasks still require manual human involvement:
Sensor Installation and Deployment
Why Required: Initial installation of the Lume device requires trained technicians to ensure proper installation and network connectivity.
Integration with Digital System: The installed sensor is logged manually and linked to the cloud-based platform.
Routine Maintenance
Why Required: To maintain data accuracy, periodic physical inspection and maintenance of the sensor hardware is required (e.g., cleaning optical components, charging/replacing batteries).
Periodic Water Quality Validation and Calibration
Why Required: Manual water sampling using lab or field-based tests (e.g., membrane filtration or Compartment Bag Test) may be periodically conducted to validate the Lume’s automated microbial readings.
Integration with Digital System: Validation results are manually recorded and can be used to assess the performance of the estimation model.
Future Digitization: Future improvements could include integration of field kit results into the cloud dashboard and automated comparison with Lume data for real-time model refinement.
Verification and Interpretation of Outliers or Data Gaps
Why Required: While most data anomalies, such as sensor offline periods, are flagged automatically, human interpretation is needed to determine cause and whether corrective action is warranted.
Integration of Digital and Manual Processes
The dMRV system combines automated and manual processes in a complementary manner to ensure verifiable monitoring of safe water delivery. Automated microbial monitoring and data transmission via the Lume sensor form the backbone of the system, generating continuous, time-stamped water quality data without the need for manual intervention.
Manual interventions, such as sensor maintenance and repairs, are triggered by automated alerts (e.g., sensor offline or abnormal readings). Alerts identify intervention requirements at designated thresholds and are logged to ensure traceability of manual actions.
Periodic water quality validation will be performed with field compartment bag tests. Time-stamped water quality data will be recorded by enumerators in mWater, a cloud-based data platform. Data will be used to validate and continuously improve the Lume estimation model.
Data Collection & Management
Parameters to be Measured
Primary Parameter
SDWS 18 – Microbial Drinking Water Quality: Measured using the Lume sensor, which detects tryptophan-like fluorescence (TLF) as an estimate of E. coli contamination within the same error bounds as lab-based methods.
Exploratory Parameters
- SDWS 23 – Quantity of Safe Water Provided (pilot phase): Inferred from the presence / absence of treated water in the safe water storage container. The Lume has a water presence sensor. As water is filled and consumed, the Lume can count fill/empty events.
- SDWS 27 – Days of Operation: Inferred from the presence / absence of treated water in the safe water storage container. This is an exploratory parameter as it is also possible users will maintain the storage full without consuming it.
Data Sources and Collection Methods
- Source: Raw sensor data captured by Lume devices deployed at the point of water consumption (e.g., safe storage containers fed by the project’s treatment system (filtration, chlorination, etc.)).
- Method: Sensors autonomously collect data at pre-programmed intervals (e.g., daily or hourly). Data is stored locally on the device and transmitted via cellular network to a secure cloud-based platform.
- Sample: At least as many samples as required by the existing methodology for annual water quality monitoring.
- Metadata: Each reading includes a timestamp, device ID, and location.
Quality Assurance and Control Measures
Automated QA/QC
- Internal checks on sensor function and signal quality.
- Real-time flagging of anomalies such as missing data, out-of-range values, or extended inactivity.
- Offline, low battery and extended inactivity of sensors generate a maintenance ticket for field technicians.
- Anomalous data generate a notification on dashboards, flagging the date/time and extent of the anomaly.
Manual QA/QC
- Field technician maintenance and calibration logs.
- Physical logs are entered into the digital platforms for accessible auditing and tracking of O&M and sampling activities.
- Periodic water quality validation using field kits or lab tests to compare with sensor outputs.
- Water quality data from field testing are logged in mWater and validated against the estimation model.
- Flagged and anomalous data are manually reviewed and tracked when resolved/corrected/interpreted.
Reporting Structure, Frequency, and KPIs
Reporting Structure: Web-based dashboard for real-time monitoring and historical data visualization.
Reporting Frequency:
- Data sampling: configurable (e.g., hourly, daily)
- Data reporting: configurable and subject to network reliability
Key Performance Indicators:
- Percentage of days with confirmed safe water delivery (SDWS 18)
- Percentage of sensor locations with no contamination events detected
- Percentage of water treatment system days in use (SDWS 27)
- Estimate of fill / empty treatment volumes (SDWS 23)
Data Storage and Security Protocols
- Infrastructure: Cloud-based servers with cellular transmission.
- Access Controls: Data can be locked and access granted for project staff, verifiers, and auditors.
- Confidentiality: No personally identifiable user data is collected. Device IDs and location metadata can be anonymized where required for compliance.
Expected Outcomes & Impact
Improved Accuracy in GHG Emissions Measurement and Reporting
Traditional MRV methods rely on infrequent, single point-in-time, water quality testing, user surveys, or physical inspections, which introduce potential uncertainty and may fail to capture variability in system performance over time.
This high-frequency monitoring enables the detection of potential temporal trends in water quality and increases the likelihood of capturing contamination events if they occur. As a result, the dMRV system offers stronger assurance that claimed emission reductions are backed by reliable, continuous evidence of safe water delivery.
We anticipate having sensors installed continuously at a sample of water treatment systems, enabling at least 200× more daily samples than currently required in the Gold Standard methodology.
Enhanced Data Transparency and Accessibility for Stakeholders
The dMRV system provides real-time access to performance data via secure cloud dashboards, enabling project developers, verifiers, and Gold Standard reviewers to evaluate project outcomes at any time. This reduces information asymmetry between project operators, auditors, and credit buyers.
Reduced Time and Cost Associated with MRV Processes
By automating microbial monitoring, data transmission, and reporting, the system reduces the need for frequent field visits, lab testing, and manual data processing. This lowers the overall cost per data point while improving the confidence and resolution of MRV outputs.
Increased Confidence in Carbon Credit Generation and Trading
Digitized water quality data provides a higher level of assurance to buyers and certification bodies that claimed emissions reductions are backed by verifiable, high-resolution water quality data.
| Metric | Traditional MRV | Lume-enabled dMRV | Improvement |
|---|---|---|---|
| Microbial sampling frequency | Quarterly to annual | Hourly or daily | 100×+ |
| Data completeness | Limited (discrete samples) | Continuous stream | Significantly improved |
| Human involvement | High | Low | Reduced cost & error |
| Auditability | Moderate (paper-based) | High (cloud-based, time-stamped) | Stronger transparency |
| GHG estimation confidence | Medium | High | Greater accuracy & conservativeness |
Revisions to the Applied Methodology
Methodology Revisions for dMRV Implementation
This dMRV solution proposes minor updates to the Gold Standard methodology titled “Emission Reductions from Safe Drinking Water Supply” (Version 1.0) to accommodate the integration of Virridy’s Lume digital monitoring technology.
Specific Modifications Required
Allow the use of automated microbial monitoring devices (e.g. the Lume) on a statistically random and valid sample of installed water treatment systems to replace or complement manual sampling for SDWS Parameter 18 (Microbial Drinking Water Quality).
Justification for Each Proposed Change
The current methodology relies on periodic manual testing or indirect evidence of water quality. Automated, high-frequency measurements provide a higher resolution dataset that can detect performance fluctuations and contamination events in near real time, substantially improving data quality for emissions quantification.
Alignment with Methodology’s Original Intent
The methodology’s core intent is to conservatively quantify GHG emission reductions resulting from reduced boiling of water for purification. The dMRV solution enhances this intent by providing stronger, more continuous evidence that water treatment systems are effectively delivering safe water — the foundational assumption behind the crediting of emissions reductions.
Potential Impacts on Emissions Calculations
The quantification approach remains unchanged, but the underlying assumptions about technology performance are now supported by continuous digital evidence rather than periodic manual verification, improving overall confidence in credited emissions reductions.
Risk Assessment & Mitigation
The implementation of a digital MRV system introduces a range of technical, operational, and contextual risks. The table below outlines the key risks associated with the use of Virridy’s Lume device in the proposed dMRV application and corresponding mitigation strategies.
| Risk | Description | Mitigation |
|---|---|---|
| Connectivity & Data Transmission Failures | In areas with limited or unreliable cellular network coverage, real-time data transmission from the Lume sensor to the cloud platform may be interrupted. | Lume includes local data storage to buffer readings during outages. Data is automatically uploaded once connectivity is restored. Site selection considers network strength, and alternative communication protocols can be evaluated. |
| Sensor Malfunction or Calibration Drift | Over time, sensors may drift or malfunction, leading to inaccurate microbial readings. | The estimation model accounts for signal variability via per-sensor baseline normalization. Preventive maintenance schedules (lens cleaning), periodic field sampling for model validation, and remote sensor diagnostics are part of the solution. |
| Power Supply Interruptions | The Lume sensor may stop functioning due to depleted or damaged power sources (e.g., battery failure). | Low-power design with swappable, rechargeable batteries. Battery status is monitored remotely via diagnostics, and field teams are alerted to replace or recharge units before power loss. |
| Data Gaps & Incomplete Records | Equipment failure or transmission delays may result in missing data, affecting the completeness of the MRV dataset. | Automated data integrity checks and alerts. Gaps are investigated by field teams, and assumptions around data completeness are transparently documented during reporting. |
| Limited Local Maintenance Capacity | In rural deployment areas, limited technical expertise may delay troubleshooting or repairs. | Virridy’s local technicians are trained on installation, maintenance, and supported with remote diagnostics. |
| Cybersecurity & Data Privacy | Unauthorized access to cloud systems could compromise data integrity or violate privacy protocols. | Role-based access controls on the platform. No personally identifiable information is collected, minimizing privacy concerns. |
Scalability & Replicability
The proposed dMRV solution is designed for scalability across geographies and adaptable for other water project types and sectors. Its portable and compact design, use of cellular networks, and cloud-based data architecture make it suitable for a variety of deployment contexts.
Expansion Potential
The Lume device can be deployed across a wide range of institutional, household, or community water treatment systems. Scaling to additional regions is feasible wherever basic mobile connectivity is available, and the solution requires minimal on-site infrastructure.
Adaptability
The solution is not limited to institutional filter projects; it can be adapted to other water projects (e.g., community water supply, household water treatment). The sensor can be potentially customized for different deployment contexts and regulatory frameworks.
Scaling Cost-Effectiveness
Per-site costs decrease significantly at scale due to economies of scale in hardware procurement, cloud hosting, and technician training. Automated data workflows reduce MRV transaction costs over time.
Financial Capacity
Initial capital for dMRV deployment is allocated within the broader project implementation budget. Additionally, the Lume sensor’s applicability across other sectors (e.g., environmental monitoring) creates potential for cross-subsidization and diversified funding sources.
Skilled Workforce
Local technicians are trained to install, maintain, and troubleshoot Lume sensors, ensuring immediate on-the-ground capacity. However, the dMRV system is designed to be delivered as a subscription-based service, where Virridy provides ongoing hardware support, data management, cloud hosting, and model maintenance. This reduces the dependence on local technical expertise for system operation.
Active Project Locations
Virridy currently operates carbon credit projects across multiple countries in Sub-Saharan Africa:
Sustainability & Accessibility
Sustainability Performance
The dMRV solution offers clear environmental benefits over conventional MRV approaches while maintaining a minimal footprint.
- Energy Consumption: Lume sensors are low-power devices designed for extended use on small rechargeable or replaceable batteries. Optional solar configurations further reduce reliance on grid-based electricity, and the energy consumption of the sensor itself is negligible in the context of typical rural water treatment systems.
- GHG Emissions: The system reduces emissions associated with conventional MRV activities by minimizing the need for frequent travel to conduct manual sampling and inspections.
- E-waste Generation: Sensors are built for multi-year use with durable components. Virridy’s subscription model means that sensors are returned and components reused. There are also recycling options for end-of-life electronics.
- Relative Efficiency: Compared to conventional MRV, the digital system provides comparable accuracy at a lower environmental cost. It also compares favorably to other digital MRV tools due to its integrated hardware-software approach and low per-sample cost.
Supplementary Evidence
Please see:
- thelume.ai/research — Validated performance data and methodology
- virridy.com/lume-analytics/
- virridy.com/lume-performance-2025/
- virridy.com/lume-performance
Accessibility
The dMRV solution is designed to be low-maintenance, and accessible to users and stakeholders with minimal technical expertise.
- Simple Deployment: The Lume sensor is plug-and-play, with minimal setup requirements.
- Automated Monitoring: Once installed, the system operates autonomously — collecting, transmitting, and processing data without user intervention.
- User-Friendly Dashboard: Stakeholders can access real-time and historical data through a web-based dashboard with clear visualizations and automated summaries (see live dashboard below).
- Minimal Maintenance Burden: Preventive maintenance and diagnostics are handled by Virridy under a subscription model.
- Training & Support: Basic training on system use and interpretation is provided to local staff and partners. Remote support is available.
Live Sensor Dashboard
The Lume dashboard provides real-time sensor telemetry, water quality classifications, and historical data visualizations:
Transparency, Auditability & Compliance
Methods for Accessing and Reviewing Raw Data
Raw data can be accessed and reviewed through the cloud platform API or retrieved as .csv or .xlsx files from the Virridy team. To protect their integrity, raw data are never directly edited or used in their raw form for reporting. Instead, raw data are processed through the estimation model, which outputs water quality estimates and classifications for reporting.
Processes for Verifying Calculations and Algorithms
E. coli estimates and categorization with the estimation model can be verified with the designated coefficients and features. The model is a closed-form Tobit regression with 8 published coefficients. Feature data are the sensor inputs used to predict E. coli: baseline-subtracted raw fluorescence (mon2), water temperature, and the baseline-subtracted turbidity proxy (tof), together with a per-sensor 2-point calibration (offset + gain: per-sensor intercept offsets and per-sensor fluorescence slopes). All coefficients and feature data are available for verification by auditors.
Raw and processed data is available to an auditor. Non-conflicted third party academics at the University of Colorado Boulder and Colorado State University will provide an independent analysis of the model and approach.
MRV Performance Standards
The dMRV solution meets and in some instances exceeds MRV performance standards and IT/cybersecurity requirements set by Gold Standard and other certification bodies.
The system enables high-confidence certification by providing:
- Continuous, time-stamped data on microbial water quality (SDWS 18), aligned with the methodology’s requirement to demonstrate consistent delivery of safe water.
- Automated reporting with traceable data trails, enhancing transparency and reducing the risk of manipulation.
- Audit-ready outputs, including raw data exports, algorithm documentation, and calibration records, supporting third-party verification of results. VVBs will receive secure, role-based access to a dedicated verification portal.
IT and Cybersecurity Compliance
The platform follows current best practices in data security and privacy:
- Data Encryption: All data transmitted from sensors to the cloud is encrypted (SSL/TLS).
- Access Controls: Role-based permissions restrict access to sensitive information; audit logs track all system activity.
- Data Integrity: Raw data is immutable and stored with automated backups; no retroactive edits are permitted.
- Privacy Protection: No personally identifiable user data is collected. Device metadata (e.g., location) is anonymized or pseudonymized where required.
Supporting Ecosystem
The dMRV solution is supported by a robust ecosystem of technical infrastructure, trained personnel, and expert partnerships that ensure reliable operation and long-term scalability.
Technical Support and Maintenance
Virridy provides technical support for the Lume sensor through a subscription-based service model. This includes:
- Remote diagnostics of sensor malfunctions and data anomalies
- Firmware updates and backend improvements deployed remotely
- Hardware upgrades when improved models become available
- Local field teams trained to troubleshoot and respond to on-site issues
- Scheduled preventive maintenance and calibration checks
This model ensures continued system performance while reducing the long-term technical burden on local project owners.
Training Programs
Local technicians and project staff are trained in:
- Sensor installation and commissioning
- Basic maintenance and troubleshooting
- Data interpretation and dashboard usage
Partnership
The dMRV solution benefits from strategic collaborations, including:
- A close partnership between Virridy and the University of Colorado Boulder to support ongoing research and development of the Lume sensor
- Coordination with local implementation partners to support deployment logistics and on-the-ground operations
This integrated support system ensures that the dMRV solution remains functional, auditable, and aligned with evolving certification and technology standards.
Pilot Deployment Plan
Lume sensor validation (Rwanda + Kenya) and permanent O&M installation on DRIP FUNDI piped systems in Kenya
This pilot deploys the Virridy Lume sensor in two phases. Phase 1 uses Lume in a mobile configuration to rapidly build a CBT-validated dataset, collecting paired water samples across the Amazi Meza program in Rwanda and the DRIP FUNDI program in Kenya. Phase 2 installs Lume permanently on a representative sample of DRIP FUNDI piped water systems in Kenya for continuous, program-level operations & maintenance monitoring and for SDWS 23/27 flow-parameter validation. (Phase 2 venue updated from the originally approved Amazi Meza, Rwanda; see the revision note in the Phase 2 section.)
Together, these phases establish the validation evidence required by the dMRV Pilot 14 approval and the operational infrastructure for scaled digital monitoring of the Amazi Meza program.
Strategic Rationale
Why Mobile-First Validation?
Rather than installing Lume sensors permanently at Amazi Meza schools for the validation phase — which would require extensive installation effort and repeated site visits to collect water samples — a mobile Lume configuration enables rapid, high-throughput data collection:
- Speed: A field team can visit many schools per day, collecting pre- and post-filtration samples at each, generating far more paired data points than fixed installations waiting for periodic sample collection.
- Diversity: Mobile deployment reaches a wide variety of schools, filter conditions, and source water quality levels across Rwanda, producing a more representative and robust validation dataset.
- Efficiency: Eliminates the installation burden for validation — no mounting, no power provisioning, no connectivity setup at every school. The Lume is carried to the classroom, measurements are taken, and the team moves on.
Why CBTs Instead of Colilert?
The Compartment Bag Test is the ideal reference method for this validation because:
- WASH alignment: CBTs produce WHO risk category classifications (low, intermediate, high, very high) that directly map to the Lume’s categorical output — building a model purpose-built for WASH program monitoring.
- Field practicality: CBTs require no lab infrastructure, no cold chain, and no expensive consumables. A field team carries everything needed across Rwanda’s varied terrain.
- Cost: At ~$2–3 per test, CBTs enable large sample sizes within budget. Colilert at ~$12–15 per test would limit the number of paired samples collected.
- Regulatory fit: CBT-based models are directly applicable to the Gold Standard methodology, which requires evidence of microbial drinking water quality at WHO risk thresholds.
Amazi Meza Program
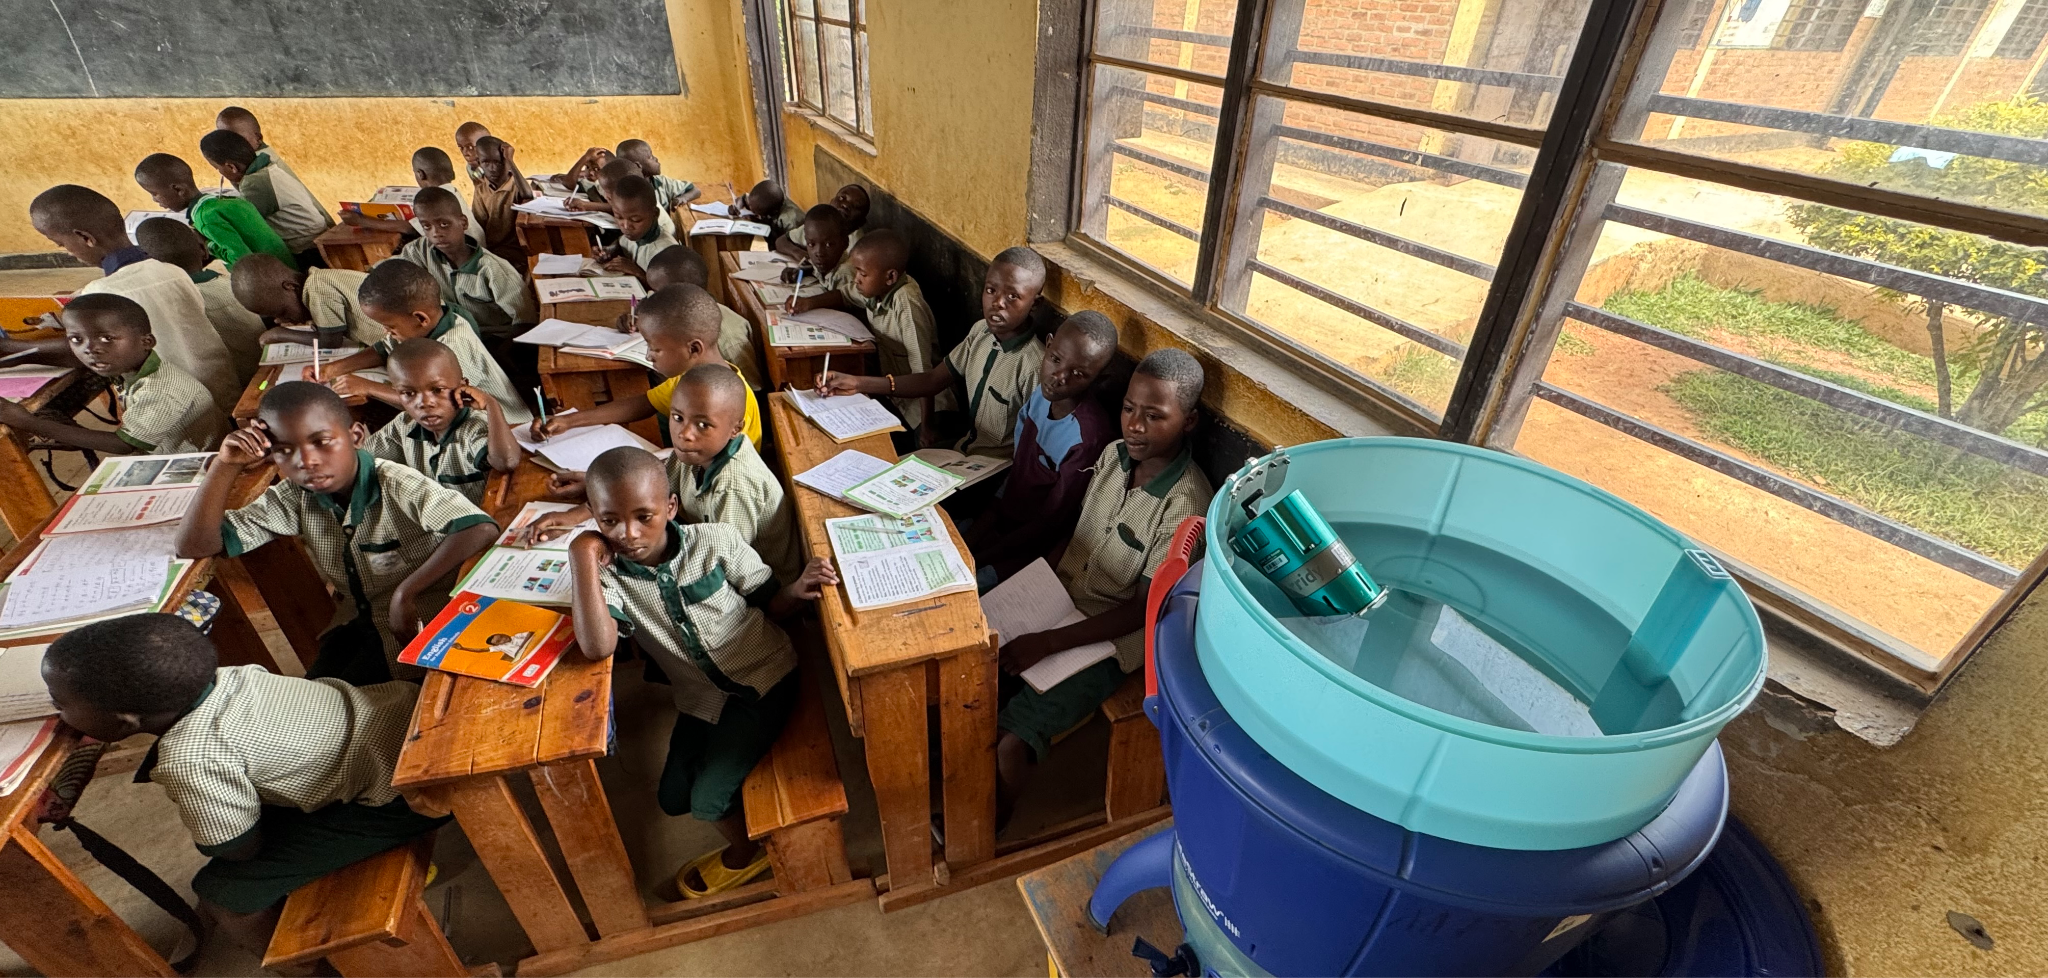
Amazi Meza (“Clean Water” in Kinyarwanda) is Virridy’s school-based drinking water program in Rwanda. LifeStraw Community gravity-fed purifiers are installed in classrooms, providing safe drinking water to students without the need for boiling. The program is operated by Virridy Rwanda Ltd in partnership with the Rwanda Environmental Management Authority (REMA) and district governments, and is sustainably financed through carbon credit sales.
Why Amazi Meza for dMRV Pilot?
- Virridy-operated: Direct operational control over sensor deployment, maintenance schedules, and data collection — critical for a pilot where rapid iteration and close coordination are required.
- Scale: 500+ schools today, scaling to 1,500 by 2028, provides a large pool of sites with consistent treatment technology.
- Gold Standard methodology: Already operating under the same “Emission Reductions from Safe Drinking Water Supply” methodology that Pilot 14 targets.
- Classroom deployment: LifeStraw Community filters installed directly in classrooms create a controlled, accessible sampling environment with clear pre- and post-filtration sampling points.
- Source water diversity: Schools across Rwanda draw from a variety of sources, providing a range of pre-treatment water quality for model training.
Sampling Points
| Sample Point | Location | Expected Water Quality |
|---|---|---|
| Pre-treatment (source) | Source water inlet / raw (untreated) water before the treatment unit | Variable E. coli levels depending on source |
| Post-treatment (treated) | Treated water outlet from the treatment unit | <1 CFU/100mL (if filter intact and functioning) |
Phase 1: Mobile Lume Validation
Objective
Deploy Lume sensors in a mobile (handheld) configuration across Rwanda (Amazi Meza) and Kenya (DRIP), collecting paired Lume readings and Compartment Bag Test samples at pre- and post-filtration points. This builds the CBT-validated dataset required for dMRV model calibration and satisfies FAR 1 (Sensor Validation) and FAR 2 (Model Documentation).
Approach
A Virridy Rwanda field team travels to schools with portable Lume sensors and CBT kits. At each school, two paired measurements are taken per classroom filter sampled:
Each school visit produces at minimum 2 paired Lume–CBT data points. Schools with multiple classroom filters can yield additional pairs per visit. The dataset grows rapidly compared to fixed-installation approaches.
Data Collection Targets
| Parameter | Target |
|---|---|
| Schools visited | 80–120 |
| Paired samples per school (pre + post filtration) | 2–4 (depending on number of classroom filters) |
| Total paired Lume–CBT samples | 200–300 |
| Repeat visits (subset for temporal variability) | 15–25 schools |
| Total paired samples (incl. repeats) | 250–350 |
Phase 1 Results (as of June 2026)
Phase 1 mobile validation is underway across two programs:
| Parameter | Actual |
|---|---|
| Sensors deployed | 3 — 50045 (Rwanda/Amazi Meza), 50053 (Kenya/DRIP), 50065 (both programs) |
| Date range | May 25 – June 11, 2026 |
| CBT samples collected | 123 |
| Paired Lume–CBT points (in-water matched) | 216 |
| Sampling type | Source (untreated) 109 + Treated (post-filtration/chlorination) 107 |
Rwanda sites (Amazi Meza)
EP Nyakabungo, EP Nyakabuye, EP Rwishwima, plus warehouse test sites in Kicukiro and Kamonyi districts.
Kenya sites (DRIP)
Isiolo County (Garbatula, Ngaremara), Turkana County (Loima, Turkana South, Turkana West).
Model performance
| Metric | Value |
|---|---|
| LOOCV agreement (±0.92 log10) | 88% (191/216) |
| Balanced accuracy (≥10 CFU) | 85% (sens=76%, spec=93%, AUC=0.892) |
| Balanced accuracy (≥1 CFU) | 71% (sens=50%, spec=93%, AUC=0.761) |
| Per-sensor: 50045 | 85% (n=48) |
| Per-sensor: 50053 | 98% (n=52) |
| Per-sensor: 50065 | 85% (n=116) |
Live validation results: validation.thelume.ai/cbt
Field Protocol
Mobile Lume + CBT Workflow
Arrive at School
Record GPS coordinates, school name, number of classroom filters, filter serial numbers, and system status.
Pre-Treatment (Source) Sample
Collect water from the untreated source (raw water inlet before the treatment unit). Take Lume reading (60 seconds). Fill CBT bag from same source.
Post-Treatment (Treated) Sample
Collect water from the treated output (treatment-unit outlet). Take Lume reading (60 seconds). Fill CBT bag from same source.
Incubate CBTs
Seal and label CBT bags (school ID, sample point, date/time). Incubate at ambient temperature for 24–48 hours. Read and record WHO risk category result.
Data Entry
Upload paired Lume–CBT data to cloud platform. Lume readings auto-sync; CBT results entered via mobile app with school ID linkage.
Quality Assurance
- Duplicate samples: At 10% of schools, collect duplicate CBTs from the same water source to assess inter-test variability.
- Blank controls: Include field blanks (sterile water through CBT) at least once per sampling day.
- Lume calibration check: Verify Lume baseline against known clean water reference at start of each sampling day.
- Photo documentation: Photograph each sampling point, the treatment unit, and the CBT result for audit trail.
Equipment per Field Team
| Item | Quantity | Purpose |
|---|---|---|
| Lume sensor (mobile config) | 2 | Primary + backup for simultaneous pre/post sampling |
| CBT kits | 20–30 per day | 2–4 per school + duplicates + blanks |
| Sample collection bottles | 10 | Sterile 500mL bottles, reused after decontamination |
| GPS-enabled phone/tablet | 1 | School logging, photo documentation, CBT data entry |
| Incubation container | 1 | Portable insulated box for ambient-temp CBT incubation |
| Clean water reference | 1L | Daily Lume calibration check |
Daily Throughput
With two Lume sensors and efficient routing between schools, a field team can visit 8–12 schools per day, generating 16–36 paired Lume–CBT samples. A three-week field campaign yields 250–350 paired samples.
Validation Dataset Design
Dataset Structure
Each record in the validation dataset contains:
| Field | Source | Description |
|---|---|---|
| School ID | Field team | Unique identifier linked to Amazi Meza program database |
| GPS coordinates | Phone/tablet | Latitude/longitude of school |
| Sample point | Field team | Source (pre-treatment) or treated (post-treatment) |
| Treatment-unit serial number | Site metadata | Treatment-unit identifier (e.g., filter or chlorination dispenser) |
| Treatment-unit age / last maintenance | Program records | Days since installation or last backwash/replacement |
| Lume TLF intensity | Lume sensor | Tryptophan-like fluorescence (ppb) |
| Lume turbidity | Lume sensor | NTU reading from integrated sensor |
| Lume temperature | Lume sensor | Water temperature (°C) |
| CBT WHO risk category | CBT result | Low / Intermediate / High / Very High |
| CBT MPN estimate | CBT result | Most Probable Number E. coli per 100mL |
| Filter status | Field team | Operational / partially functional / non-functional |
| Classroom location | Field team | Classroom number or identifier within school |
| Timestamp | Auto | Date and time of sampling |
Model Development Approach
- Training target: log10(CFU+1) via Tobit (right-censored at CBT detection limit of 100 CFU/100 mL), yielding both continuous CFU estimates and WHO risk category classification.
- Input features: Baseline-subtracted raw fluorescence (
mon2), water temperature, baseline-subtracted turbidity proxy (tof), and a per-sensor 2-point calibration (offset + gain: per-sensor intercept offsets and per-sensor fluorescence slopes). Temperature is an explicit predictor, not a pre-correction. - Algorithm: Right-censored OLS (Tobit with EM imputation). No ML, no ensemble methods, no black-box models. The model is a closed-form linear regression fully specified by 8 published coefficients.
- Validation: Leave-one-out cross-validation (LOOCV), testing every observation against a model trained on all other observations. Validation is leave-one-observation-out because each sensor’s per-sensor fixed effects are that sensor’s calibration, so an uncalibrated, entirely held-out sensor is not a deployment scenario.
- Performance: 88% LOOCV agreement within ±0.92 log10 of CBT reference; at the ≥10 CFU/100 mL threshold, 85% balanced accuracy with the deployed Tobit thresholded (sens 76%, spec 93%, AUC 0.892) and 83% with a class-balanced logistic classifier (sens 84%, spec 82%, AUC 0.885). Live results at validation.thelume.ai/cbt.
Mobile vs. Fixed Installation
Phase 2: Permanent Installation
The originally approved Implementation Plan sited Phase 2 permanent installations at Amazi Meza schools in Rwanda. Based on the completed Phase 1 mobile validation (conducted across both Rwanda and Kenya), Virridy is updating this plan to site Phase 2 long-term installation validation on the DRIP FUNDI piped water systems in Kenya, because piped infrastructure is the appropriate setting to validate the SDWS 23 (volume) and SDWS 27 (operational days) flow parameters. This update is a request pending Gold Standard approval; the formal request is set out in Pilot Report v0.2. Amazi Meza (Rwanda) remains the approved host crediting programme.
Objective
Install Lume sensors permanently at a statistically representative sample of at least 20 DRIP FUNDI piped water systems in Kenya to provide continuous, program-level operations and maintenance monitoring, and to validate the SDWS 23 (volume) and SDWS 27 (operational days) flow parameters that piped infrastructure is best suited to demonstrate. This satisfies FAR 3 (Integration of Manual and Digital Processes) and establishes the operational dMRV infrastructure for ongoing carbon credit verification.
Site Selection
| Parameter | Value |
|---|---|
| Systems in program | DRIP FUNDI: ~200 boreholes / piped community water points serving ~120,000 people |
| Lume installations | At least 20 DRIP FUNDI sites (target 30–50 sensors) |
| Sample rate | ~10–25% of the DRIP FUNDI piped-system program |
| Selection criteria | County-level representation across the DRIP FUNDI service area (Isiolo, Turkana), mix of source water types and piped-system configurations, and urban/rural settings |
Installation Scope
- Lume sensor mounted in the piped flow path at the treated-water output (point of use / point of collection).
- Cellular connectivity for automated data transmission to the Virridy cloud platform.
- Water presence / flow sensor for system uptime (SDWS 27) and dispensed-volume inference (SDWS 23) on the piped system.
- Power solution appropriate to site conditions (rechargeable battery or solar).
O&M Monitoring Capabilities
| Parameter | Method | O&M Application |
|---|---|---|
| Microbial water quality | TLF → Tobit regression → WHO risk category | Detect treatment failures, breakthrough, and contamination events |
| System uptime | Water presence/absence sensor | Track operational days, detect extended downtime or service interruptions (SDWS 27) |
| Treatment volume proxy | Water flow event counting | Estimate daily treated/dispensed water volume (SDWS 23) |
| Treatment integrity | Post-treatment TLF trending | Detect gradual treatment degradation, chlorination failure, or breakthrough |
Automated Alerts
- Water quality alert: WHO risk category exceeds “Low” at the point of use → dispatch the Virridy field team to inspect the system.
- Uptime alert: System offline >48 hours during expected service hours → investigate system status.
- Trend alert: Gradual TLF increase over 7-day window → schedule preventive maintenance or treatment servicing.
- Calibration alert: Sensor diagnostics indicate drift → schedule recalibration or replacement.
Integration with Existing O&M
- Scheduled visits continue: Regular site visits for system maintenance, servicing, and water quality testing remain part of the program.
- Data-driven prioritization: Lume data identifies which systems need urgent attention, allowing maintenance teams to prioritize routes across the service area.
- Continuous evidence between visits: Lume provides day-to-day water quality data rather than a snapshot on visit day.
- CBT cross-checks: During scheduled visits, field teams collect CBT samples at Lume-instrumented sites, providing ongoing validation.
Implementation Timeline
| Phase | Activity | Duration | Deliverable |
|---|---|---|---|
| Phase 1 Mobile |
Logistics & team training | 1–2 weeks | Trained Virridy Rwanda field teams, equipment provisioned |
| Mobile sampling campaign across Amazi Meza schools | 3–4 weeks | 250–350 paired Lume–CBT samples | |
| Repeat visits at subset of schools | 1 week | Temporal variability data at 15–25 schools | |
| Analysis | Dataset compilation & QA | 1–2 weeks | Clean, validated dataset |
| CBT-based model development | 2–4 weeks | Trained categorical classification model, validation report | |
| Phase 2 Permanent |
Site selection & installation planning | 2 weeks | 30–50 selected schools across districts |
| Permanent Lume installations | 4–6 weeks | 30–50 sensors installed and transmitting | |
| Ongoing | Continuous O&M monitoring & model refinement | Ongoing | Real-time dashboards, periodic validation reports |
Total timeline: Phase 1 mobile validation completes in ~8–10 weeks. Phase 2 permanent installations follow over an additional 6–8 weeks. Full pilot operational within 4–5 months of launch.
FAR Resolution Evidence
The pilot generates evidence to close all four Forward Action Requirements raised during Pilot 14 approval:
| FAR | Requirement | Evidence from Pilot |
|---|---|---|
| FAR 1 | Sensor Validation & Calibration | 250–350 paired Lume–CBT samples across varied filter conditions and source waters; daily calibration logs; duplicate sample QA data |
| FAR 2 | AI/ML Documentation | CBT-trained model architecture, training data provenance, cross-validation results, accuracy metrics by WHO risk category |
| FAR 3 | Manual & Digital Integration | Phase 2 permanent sites demonstrate continuous digital monitoring with periodic manual CBT cross-checks during Virridy field visits to the DRIP FUNDI piped systems in Kenya |
| FAR 4 | SDWS 23 & 27 Exploration | Permanent installations evaluate water presence sensing for uptime (SDWS 27) and volume estimation (SDWS 23) |